

Question: what is the value for b? TABLE 1 CUMULATIVE PROBABILITIES FOR THE STANDARD NORMAL DISTRIBUTION (Continued Cative probability Etries in the who give the wonder
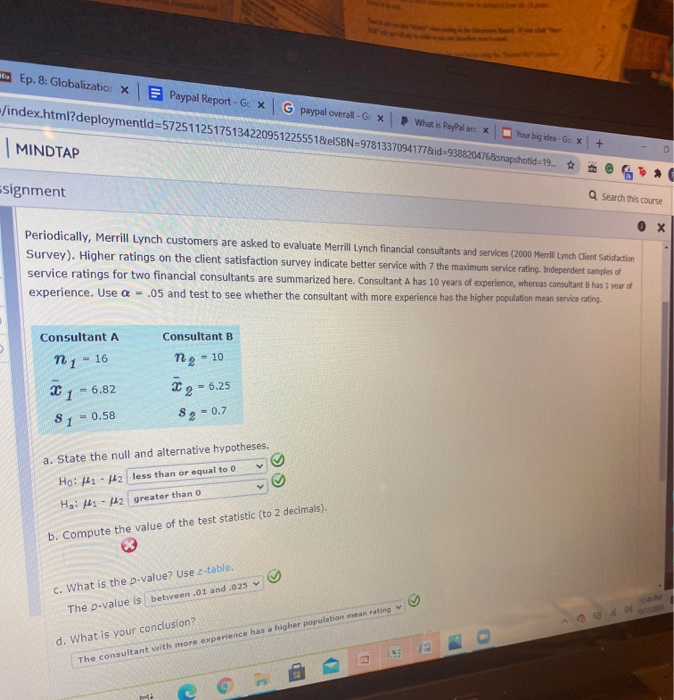
what is the value for b? 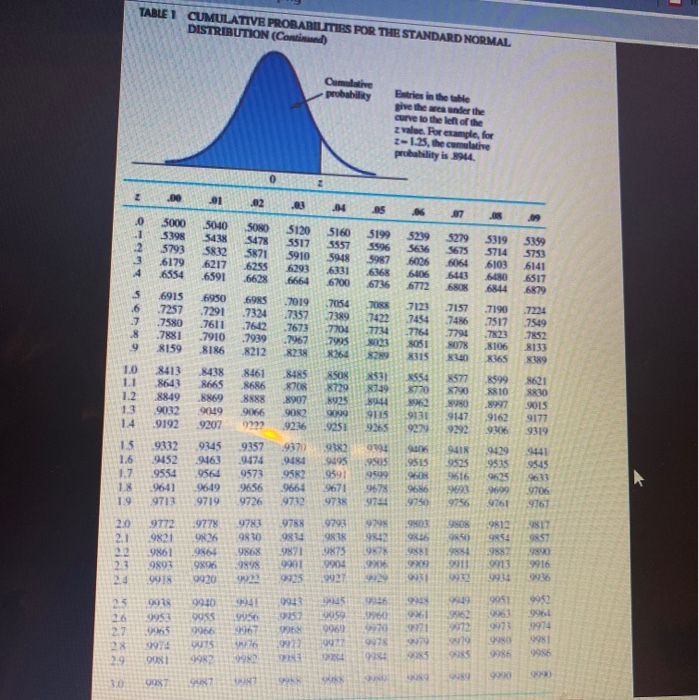
Step by Step Solution
There are 3 Steps involved in it
1 Expert Approved Answer
Step: 1 Unlock

Question Has Been Solved by an Expert!
Get step-by-step solutions from verified subject matter experts
Step: 2 Unlock
Step: 3 Unlock