

What is the weighted average cost of capital (WACC) for Marriott Corporation, under target capital structure?...
Fantastic news! We've Found the answer you've been seeking!
Question:
Transcribed Image Text:
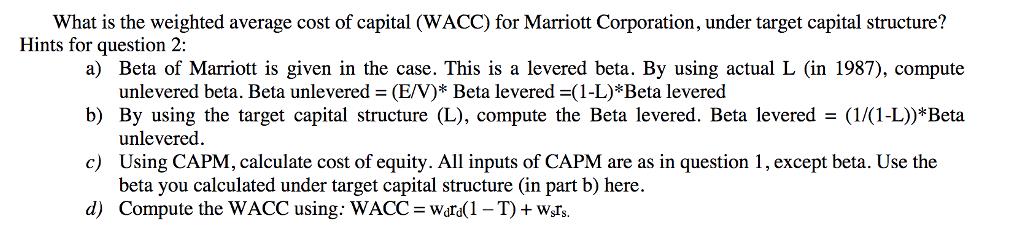
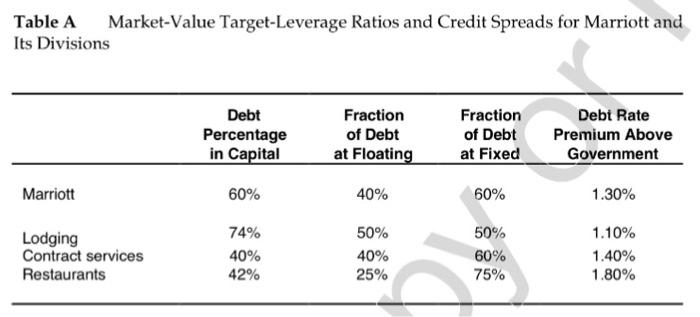
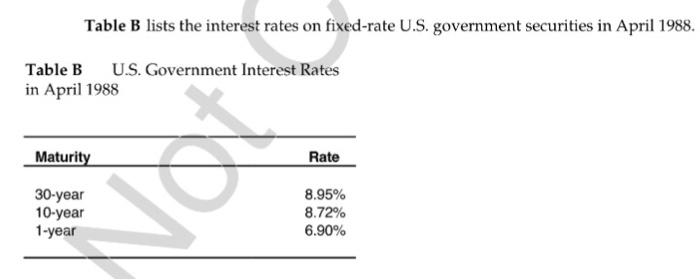
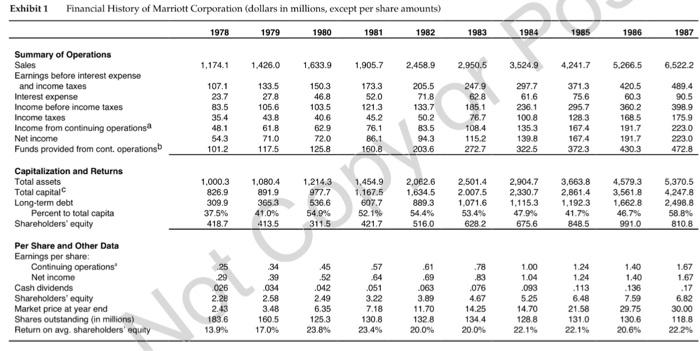
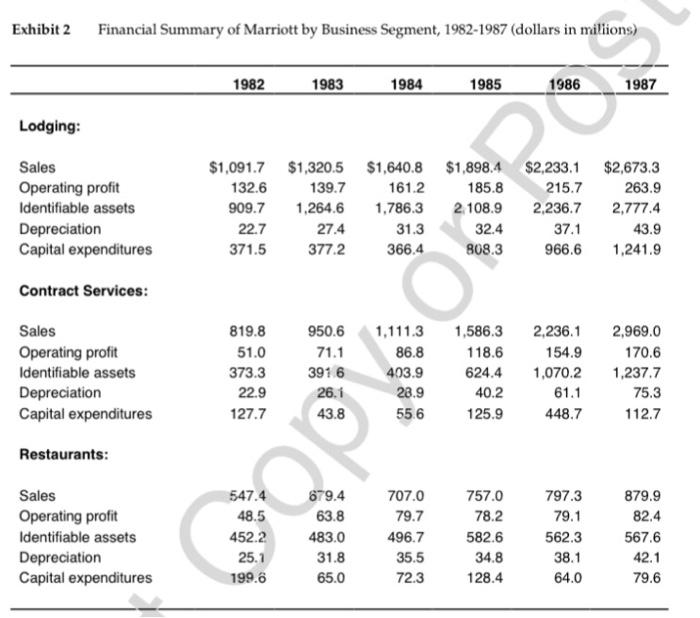
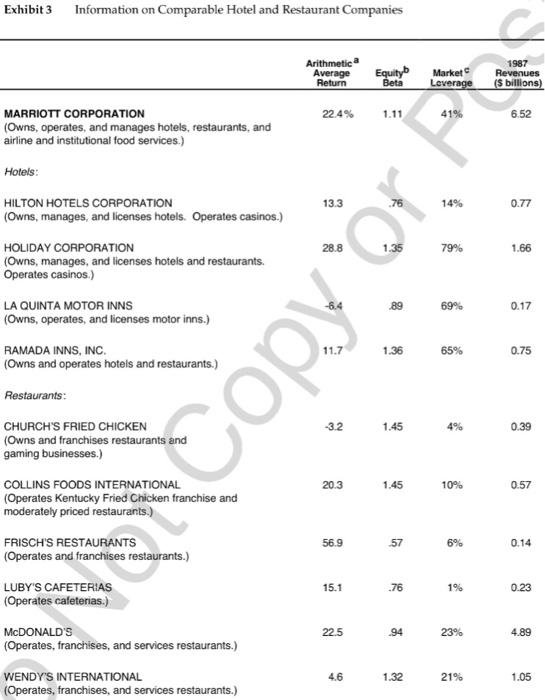
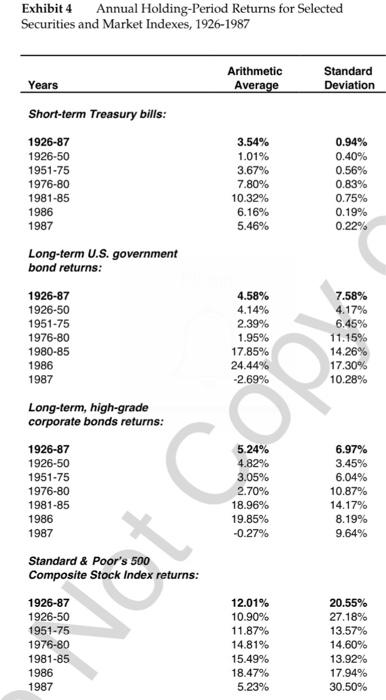
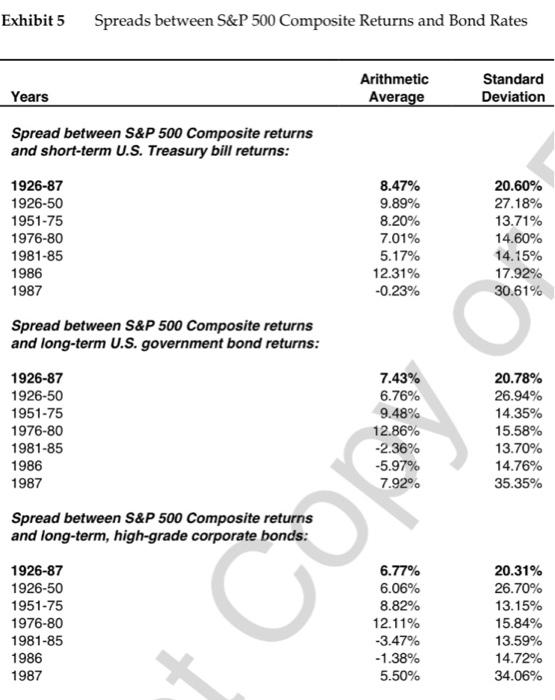
What is the weighted average cost of capital (WACC) for Marriott Corporation, under target capital structure? Hints for question 2: a) Beta of Marriott is given in the case. This is a levered beta. By using actual L (in 1987), compute unlevered beta. Beta unlevered = (E/V)* Beta levered =(1-L)*Beta levered b) By using the target capital structure (L), compute the Beta levered. Beta levered = (1/(1-L))*Beta unlevered. c) Using CAPM, calculate cost of equity. All inputs of CAPM are as in question 1, except beta. Use the beta you calculated under target capital structure (in part b) here. d) Compute the WACC using: WACC = wara(1T) + WsIs. Table A Market-Value Target-Leverage Ratios and Credit Spreads for Marriott and Its Divisions Marriott Lodging Contract services Restaurants Debt Percentage in Capital 60% 74% 40% 42% Fraction of Debt at Floating 40% 50% 40% 25% Fraction of Debt at Fixed 60% 50% 60% 75% Debt Rate Premium Above Government 1.30% 1.10% 1.40% 1.80% Table B lists the interest rates on fixed-rate U.S. government securities in April 1988. Table B U.S. Government Interest Rates in April 1988 Maturity 30-year 10-year 1-year Rate 8.95% 8.72% 6.90% Exhibit 1 Financial History of Marriott Corporation (dollars in millions, except per share amounts) 1982 Summary of Operations Sales Earnings before interest expense and income taxes Interest expense Income before income taxes Income taxes Income from continuing operations Net income Funds provided from cont. operationsb Capitalization and Returns Total assets Total capital Ⓒ Long-term debt Percent to total capita Shareholders' equity Per Share and Other Data Earnings per share: Continuing operations" Net income Cash dividends Shareholders' equity Market price at year end Shares outstanding (in millions) Return on avg. shareholders' equity 1978 1,174.1 107.1 23.7 83.5 35.4 48.1 54.3 101.2 1.000.3 826.9 309.9 37.5% 418.7 NO 1979 1,426.0 133.5 27.8 105.6 43.8 61.8 71.0 117.5 1,080.4 891.9 365.3 41.0% 413.5 1980 1,633.9 150.3 46.8 103.5 40.6 62.9 72.0 125.8 45 52 042 2.49 6.35 125.3 23.8% 1981 1,905.7 173.3 52.0 121.3 45.2 76.1 86.1 160.8 1,454.9 4999 $387 24746 57 64 051 3.22 7.18 130.8 23.4% 2,458.9 205.5 71.8 133.7 50.2 83.5 94.3 203.6 54.4% 516.0 .61 .69 063 1983 3.89 11.70 132.8 20.0% 2,950.5 247.9 62.8 185.1 2,062.6 2.501.4 1,634.5 2.007.5 889.3 1,071.6 76.7 108.4 115.2 272.7 53.4% 628 2 78 83 076 4.67 14.25 134.4 20.0% 1984 2,904.7 2,330.7 1.115.3 3,524.9 4,241.7 5,266.5 297.7 420.5 61.6 60.3 236.1 360.2 100.8 168.5 135.3 191.7 139.8 191.7 322.5 430.3 47.9% 675.6 1.00 1.04 093 5.25 1985 14.70 128.8 22.1% 371.3 75.6 295.7 128.3 167.4 167,4 372.3 1986 3,663.8 4,579.3 2,861.4 3,561.8 1,192.3 1,662.8 41.7% 46.7% 848.5 991.0 1.24 1.24 113 6.48 21.58 131.0 22.1% 1.40 1.40 136 7.59 29.75 130.6 20.6% 1987 6.522.2 489.4 90.5 398.9 175.9 223.0 223.0 472.8 5,370.5 4,247.8 2,498,8 58.8% 810.8 1.67 1.67 17 6.82 30.00 118.8 22.2% Exhibit 2 Financial Summary of Marriott by Business Segment, 1982-1987 (dollars in millions) Lodging: Sales Operating profit Identifiable assets Depreciation Capital expenditures Contract Services: Sales Operating profit Identifiable assets Depreciation Capital expenditures Restaurants: Sales Operating profit Identifiable assets Depreciation Capital expenditures 1982 $1,091.7 132.6 909.7 22.7 371.5 819.8 51.0 373.3 22.9 127.7 1983 547.4 48.5 452.2 25.1 199.6 ?/ 950.6 1,111.3 71.1 86.8 391.6 403.9 26.1 43.8 1984 $1,320.5 $1,640.8 $1,898.4 $2,233.1 $2,673.3 139.7 161.2 185.8 263.9 1,264.6 1,786.3 2,108.9 2,777.4 27.4 32.4 43.9 377.2 808.3 1,241.9 679.4 63.8 483.0 31.8 65.0 31.3 366.4 28.9 55.6 707.0 79.7 1985 496.7 35.5 72.3 118.6 624.4 40.2 125.9 1986 757.0 78.2 1,586.3 2,236.1 154.9 1,070.2 582.6 34.8 128.4 215.7 2,236.7 37.1 966.6 61.1 448.7 797.3 79.1 1987 562.3 38.1 64.0 2,969.0 170.6 1,237.7 75.3 112.7 879.9 82.4 567.6 42.1 79.6 Exhibit 3 Information on Comparable Hotel and Restaurant Companies MARRIOTT CORPORATION (Owns, operates, and manages hotels, restaurants, and airline and institutional food services.) Hotels: HILTON HOTELS CORPORATION (Owns, manages, and licenses hotels. Operates casinos.) HOLIDAY CORPORATION (Owns, manages, and licenses hotels and restaurants. Operates casinos.) LA QUINTA MOTOR INNS (Owns, operates, and licenses motor inns.) RAMADA INNS, INC. (Owns and operates hotels and restaurants.) Restaurants: CHURCH'S FRIED CHICKEN (Owns and franchises restaurants and gaming businesses.) COLLINS FOODS INTERNATIONAL (Operates Kentucky Fried Chicken franchise and moderately priced restaurants.) FRISCH'S RESTAURANTS (Operates and franchises restaurants.) LUBY'S CAFETERIAS (Operates cafeterias.) MCDONALD'S (Operates, franchises, and services restaurants.) WENDY'S INTERNATIONAL (Operates, franchises, and services restaurants.) Arithmetica Average Return 22.4% -3.2 20.3 56.9 15.1 22.5 4.6 Equityb Market Beta 89 or Copy 1.36 1.45 1.45 57 .76 94 Leverage 1.32 69% 65% 10% 6% 1% 23% c 1987 Revenues ($ billions) 21% 6.52 0.77 1.66 0.17 0.75 0.39 0.57 0.14 0.23 4.89 1.05 Exhibit 4 Annual Holding-Period Returns for Selected Securities and Market Indexes, 1926-1987 Years Short-term Treasury bills: 1926-87 1926-50 1951-75 1976-80 1981-85 1986 1987 Long-term U.S. government bond returns: 1926-87 1926-50 1951-75 1976-80 1980-85 1986 1987 Long-term, high-grade corporate bonds returns: 1926-87 1926-50 1951-75 1976-80 1981-85 1986 1987 Standard & Poor's 500 Composite Stock Index returns: 1926-87 1926-50 1951-75 1976-80 1981-85 1986 1987 Arithmetic Average 3.54% 1.01% 3.67% 7.80% 10.32% 6.16% 5.46% 4.58% 4.14% 2.39% 1.95% 17.85% 24.44% -2.69% 5 5.24% 4.82% 3.05% 2.70% 18.96% 19.85% -0.27% 12.01% 10.90% 11.87% 14.81% 15.49% 18.47% 5.23% Standard Deviation 0.94% 0.40% 0.56% 0.83% 0.75% 0.19% 0.22% 7.58% 4.17% 6.45% 11.15% 14.26% 17.30% 10.28% 6.97% 3.45% 6.04% 10.87% 14.17% 8.19% 9.64% 20.55% 27.18% 13.57% 14.60% 13.92% 17.94% 30.50% Exhibit 5 Spreads between S&P 500 Composite Returns and Bond Rates Years Spread between S&P 500 Composite returns and short-term U.S. Treasury bill returns: 1926-87 1926-50 1951-75 1976-80 1981-85 1986 1987 Spread between S&P 500 Composite returns and long-term U.S. government bond returns: 1926-87 1926-50 1951-75 1976-80 1981-85 1986 1987 Spread between S&P 500 Composite returns and long-term, high-grade corporate bonds: 1926-87 1926-50 1951-75 1976-80 1981-85 1986 1987 Arithmetic Average 8.47% 9.89% 8.20% 7.01% 5.17% 12.31% -0.23% 7.43% 6.76% 9.48% 12.86% -2.36% -5.97% 7.92% OF 6.77% 6.06% 8.82% 12.11% -3.47% -1.38% 5.50% Standard Deviation 20.60% 27.18% 13.71% 14.60% 14.15% 17.92% 30.61% 20.78% 26.94% 14.35% 15.58% 13.70% 14.76% 35.35% 20.31% 26.70% 13.15% 15.84% 13.59% 14.72% 34.06% What is the weighted average cost of capital (WACC) for Marriott Corporation, under target capital structure? Hints for question 2: a) Beta of Marriott is given in the case. This is a levered beta. By using actual L (in 1987), compute unlevered beta. Beta unlevered = (E/V)* Beta levered =(1-L)*Beta levered b) By using the target capital structure (L), compute the Beta levered. Beta levered = (1/(1-L))*Beta unlevered. c) Using CAPM, calculate cost of equity. All inputs of CAPM are as in question 1, except beta. Use the beta you calculated under target capital structure (in part b) here. d) Compute the WACC using: WACC = wara(1T) + WsIs. Table A Market-Value Target-Leverage Ratios and Credit Spreads for Marriott and Its Divisions Marriott Lodging Contract services Restaurants Debt Percentage in Capital 60% 74% 40% 42% Fraction of Debt at Floating 40% 50% 40% 25% Fraction of Debt at Fixed 60% 50% 60% 75% Debt Rate Premium Above Government 1.30% 1.10% 1.40% 1.80% Table B lists the interest rates on fixed-rate U.S. government securities in April 1988. Table B U.S. Government Interest Rates in April 1988 Maturity 30-year 10-year 1-year Rate 8.95% 8.72% 6.90% Exhibit 1 Financial History of Marriott Corporation (dollars in millions, except per share amounts) 1982 Summary of Operations Sales Earnings before interest expense and income taxes Interest expense Income before income taxes Income taxes Income from continuing operations Net income Funds provided from cont. operationsb Capitalization and Returns Total assets Total capital Ⓒ Long-term debt Percent to total capita Shareholders' equity Per Share and Other Data Earnings per share: Continuing operations" Net income Cash dividends Shareholders' equity Market price at year end Shares outstanding (in millions) Return on avg. shareholders' equity 1978 1,174.1 107.1 23.7 83.5 35.4 48.1 54.3 101.2 1.000.3 826.9 309.9 37.5% 418.7 NO 1979 1,426.0 133.5 27.8 105.6 43.8 61.8 71.0 117.5 1,080.4 891.9 365.3 41.0% 413.5 1980 1,633.9 150.3 46.8 103.5 40.6 62.9 72.0 125.8 45 52 042 2.49 6.35 125.3 23.8% 1981 1,905.7 173.3 52.0 121.3 45.2 76.1 86.1 160.8 1,454.9 4999 $387 24746 57 64 051 3.22 7.18 130.8 23.4% 2,458.9 205.5 71.8 133.7 50.2 83.5 94.3 203.6 54.4% 516.0 .61 .69 063 1983 3.89 11.70 132.8 20.0% 2,950.5 247.9 62.8 185.1 2,062.6 2.501.4 1,634.5 2.007.5 889.3 1,071.6 76.7 108.4 115.2 272.7 53.4% 628 2 78 83 076 4.67 14.25 134.4 20.0% 1984 2,904.7 2,330.7 1.115.3 3,524.9 4,241.7 5,266.5 297.7 420.5 61.6 60.3 236.1 360.2 100.8 168.5 135.3 191.7 139.8 191.7 322.5 430.3 47.9% 675.6 1.00 1.04 093 5.25 1985 14.70 128.8 22.1% 371.3 75.6 295.7 128.3 167.4 167,4 372.3 1986 3,663.8 4,579.3 2,861.4 3,561.8 1,192.3 1,662.8 41.7% 46.7% 848.5 991.0 1.24 1.24 113 6.48 21.58 131.0 22.1% 1.40 1.40 136 7.59 29.75 130.6 20.6% 1987 6.522.2 489.4 90.5 398.9 175.9 223.0 223.0 472.8 5,370.5 4,247.8 2,498,8 58.8% 810.8 1.67 1.67 17 6.82 30.00 118.8 22.2% Exhibit 2 Financial Summary of Marriott by Business Segment, 1982-1987 (dollars in millions) Lodging: Sales Operating profit Identifiable assets Depreciation Capital expenditures Contract Services: Sales Operating profit Identifiable assets Depreciation Capital expenditures Restaurants: Sales Operating profit Identifiable assets Depreciation Capital expenditures 1982 $1,091.7 132.6 909.7 22.7 371.5 819.8 51.0 373.3 22.9 127.7 1983 547.4 48.5 452.2 25.1 199.6 ?/ 950.6 1,111.3 71.1 86.8 391.6 403.9 26.1 43.8 1984 $1,320.5 $1,640.8 $1,898.4 $2,233.1 $2,673.3 139.7 161.2 185.8 263.9 1,264.6 1,786.3 2,108.9 2,777.4 27.4 32.4 43.9 377.2 808.3 1,241.9 679.4 63.8 483.0 31.8 65.0 31.3 366.4 28.9 55.6 707.0 79.7 1985 496.7 35.5 72.3 118.6 624.4 40.2 125.9 1986 757.0 78.2 1,586.3 2,236.1 154.9 1,070.2 582.6 34.8 128.4 215.7 2,236.7 37.1 966.6 61.1 448.7 797.3 79.1 1987 562.3 38.1 64.0 2,969.0 170.6 1,237.7 75.3 112.7 879.9 82.4 567.6 42.1 79.6 Exhibit 3 Information on Comparable Hotel and Restaurant Companies MARRIOTT CORPORATION (Owns, operates, and manages hotels, restaurants, and airline and institutional food services.) Hotels: HILTON HOTELS CORPORATION (Owns, manages, and licenses hotels. Operates casinos.) HOLIDAY CORPORATION (Owns, manages, and licenses hotels and restaurants. Operates casinos.) LA QUINTA MOTOR INNS (Owns, operates, and licenses motor inns.) RAMADA INNS, INC. (Owns and operates hotels and restaurants.) Restaurants: CHURCH'S FRIED CHICKEN (Owns and franchises restaurants and gaming businesses.) COLLINS FOODS INTERNATIONAL (Operates Kentucky Fried Chicken franchise and moderately priced restaurants.) FRISCH'S RESTAURANTS (Operates and franchises restaurants.) LUBY'S CAFETERIAS (Operates cafeterias.) MCDONALD'S (Operates, franchises, and services restaurants.) WENDY'S INTERNATIONAL (Operates, franchises, and services restaurants.) Arithmetica Average Return 22.4% -3.2 20.3 56.9 15.1 22.5 4.6 Equityb Market Beta 89 or Copy 1.36 1.45 1.45 57 .76 94 Leverage 1.32 69% 65% 10% 6% 1% 23% c 1987 Revenues ($ billions) 21% 6.52 0.77 1.66 0.17 0.75 0.39 0.57 0.14 0.23 4.89 1.05 Exhibit 4 Annual Holding-Period Returns for Selected Securities and Market Indexes, 1926-1987 Years Short-term Treasury bills: 1926-87 1926-50 1951-75 1976-80 1981-85 1986 1987 Long-term U.S. government bond returns: 1926-87 1926-50 1951-75 1976-80 1980-85 1986 1987 Long-term, high-grade corporate bonds returns: 1926-87 1926-50 1951-75 1976-80 1981-85 1986 1987 Standard & Poor's 500 Composite Stock Index returns: 1926-87 1926-50 1951-75 1976-80 1981-85 1986 1987 Arithmetic Average 3.54% 1.01% 3.67% 7.80% 10.32% 6.16% 5.46% 4.58% 4.14% 2.39% 1.95% 17.85% 24.44% -2.69% 5 5.24% 4.82% 3.05% 2.70% 18.96% 19.85% -0.27% 12.01% 10.90% 11.87% 14.81% 15.49% 18.47% 5.23% Standard Deviation 0.94% 0.40% 0.56% 0.83% 0.75% 0.19% 0.22% 7.58% 4.17% 6.45% 11.15% 14.26% 17.30% 10.28% 6.97% 3.45% 6.04% 10.87% 14.17% 8.19% 9.64% 20.55% 27.18% 13.57% 14.60% 13.92% 17.94% 30.50% Exhibit 5 Spreads between S&P 500 Composite Returns and Bond Rates Years Spread between S&P 500 Composite returns and short-term U.S. Treasury bill returns: 1926-87 1926-50 1951-75 1976-80 1981-85 1986 1987 Spread between S&P 500 Composite returns and long-term U.S. government bond returns: 1926-87 1926-50 1951-75 1976-80 1981-85 1986 1987 Spread between S&P 500 Composite returns and long-term, high-grade corporate bonds: 1926-87 1926-50 1951-75 1976-80 1981-85 1986 1987 Arithmetic Average 8.47% 9.89% 8.20% 7.01% 5.17% 12.31% -0.23% 7.43% 6.76% 9.48% 12.86% -2.36% -5.97% 7.92% OF 6.77% 6.06% 8.82% 12.11% -3.47% -1.38% 5.50% Standard Deviation 20.60% 27.18% 13.71% 14.60% 14.15% 17.92% 30.61% 20.78% 26.94% 14.35% 15.58% 13.70% 14.76% 35.35% 20.31% 26.70% 13.15% 15.84% 13.59% 14.72% 34.06%
Expert Answer:
Answer rating: 100% (QA)
Calculating Cost of Equity Marriott Corp utilizes the Capital Asset Pricing Model CAPM to derive the... View the full answer

Related Book For 
Intermediate Financial Management
ISBN: 9780357516669
14th Edition
Authors: Eugene F Brigham, Phillip R Daves
Posted Date:
Students also viewed these programming questions
-
9 ) List down any four international examples of Business to Business ( B 2 B ) E - commerce.
-
Ann Carter, Chief Financial Officer of Consolidated Electric Company (Con El), must make a recommendation to Con Els board of directors regarding the firms dividend policy. Con El owns two...
-
FREE-CASH-FLOWS-BASED VALUATION. In Problem, we projected financial statements for Wal-Mart Stores, Inc. (Walmart) for Years +1 through +5. The data in Exhibits 13 (see pages 985987) include the...
-
List 5 Business Uses of Location Analytics? In what way a business can use location data?
-
What are the various roles of HR in the leadership of organizations?
-
Victoria has prepared the following list of statements about corporations. 1. A corporation is an entity separate and distinct from its owners. 2. As a legal entity, a corporation has most of the...
-
The stress-strain diagram for the material of a column can be approximated as shown. Plot \(P / A\) versus \(K L / r\) for the column. (MPa) 350- 200- (in./in.) 0 0.001 0.004
-
Perkins Manufacturing is considering the sale of two non depreciable assets, X and Y. Asset X was purchased for $2,000 and will be sold today for $2,250. Asset Y was purchased for $30,000 and will be...
-
a B 0 b A Note: Triangle may not be drawn to scale. Suppose a 168 and 6 = 95. Find an exact value (report answer as a fraction). You will need to determine the length of the missing side first....
-
As a financial analyst at Glencolin International (GI) you have been asked to evaluate two capital investment alternatives submitted by the production department of the firm. Before beginning your...
-
1) Public int search(int target): if the target is found in the array, return the frequency of its showing up. If the target is not found in the array, return -1. If the array is empty, return -1; 2)...
-
Will personalized pricing through AI be the new normal in decades?
-
What might be some of the limitations to AI pricing that may slow down adoption and implementation?
-
What are the key tools and frameworks developed to help better manage pricing during the development and growth of the pricing discipline?
-
Who in an organization should be in charge of designing, running, and evaluating pricing experiments?
-
What skills and capabilities will become more important for price strategy/management in the future and why?
-
Question evaluate the followin day S A.) where xf (cosx) f(o) = f(-1) = f(1) = 2, f() = 3 f'(o) = f(-1) = -1 and f(1) = f'(x)=3
-
The following T-accounts show postings of selected transactions. Indicate the journal used in recording each of these postings a through e. Cash Accounts Receivable Inventory (d) 500 (e) 300 (b)...
-
Your project manager presents to you two mutually exclusive projects, A and B. They have the same initial investment and the WACCC is 10%. The cash flows are below. a. Calculate the IRR for each...
-
What is the Free Cash Flow to Equity (FCFE) model? How might it be applied? When is it not appropriate?
-
The president of MorChuck Enterprises has asked you to evaluate the proposed acquisition of a new chromatograph for the firms R&D department. The equipments basic price is $70,000, and it would cost...
-
Fill in the Blank. For a shaft carrying masses \(m_{1}, m_{2}, \ldots\), Rayleigh's method gives the natural frequency as \[\omega=\left\{\frac{g\left(m_{1} w_{1}+m_{2} w_{2}+\cdots ight)}{m_{1}...
-
True or False. In the matrix iteration method, any computational error will not yield incorrect results.
-
Rayleigh's method a. Finds the natural frequencies and mode shapes of the system, one at a time, using several trial values for each frequency. b. Finds all the natural frequencies using trial...

Study smarter with the SolutionInn App