

Question: What is WACC? using the template in the bottom. Selected Financial Statistics Profitability Measures Gross Operating Net Profit Profit Profit Margin Margin Margin Dividend Data
What is WACC? using the template in the bottom.
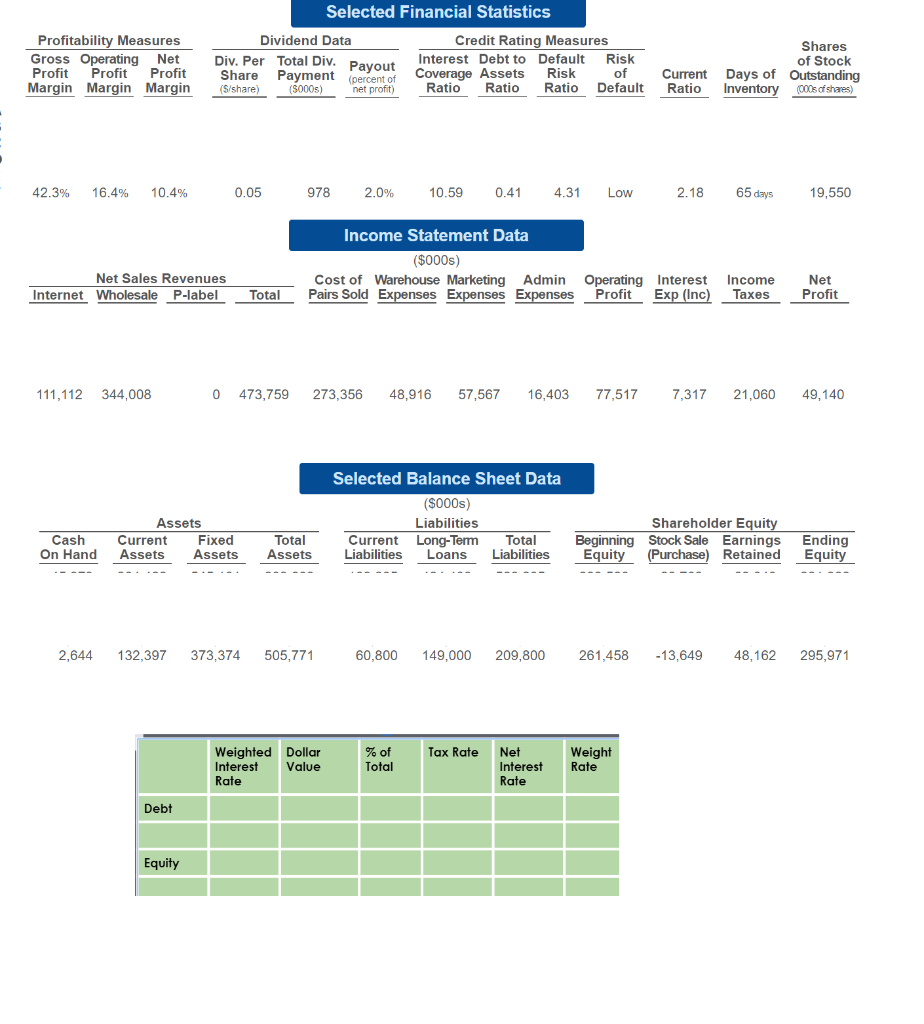
Selected Financial Statistics Profitability Measures Gross Operating Net Profit Profit Profit Margin Margin Margin Dividend Data Div. Per Total Div. Payout Share Payment terment of (S/share) (5000s) net profit) Credit Rating Measures Interest Debt to Default Risk Coverage Assets Risk of Ratio Ratio R atio Default Current Ratio Shares of Stock Days of Outstanding Inventory 000s of shares) 42.3% 16.4% 10.4% 0.05 978 2.0% 10.59 0.41 4.31 Low 2.18 65 days 19,550 Income Statement Data ($000s) Cost of Warehouse Marketing Admin Pairs Sold Expenses Expenses Expenses Net Sales Revenues Internet Wholesale P-label Operating Interest Income Profit Exp (Inc) Taxes Net Profit Total 111,112 344,008 0 473,759 273,356 48,916 57,567 16,403 77,517 7,317 21,060 49,140 Selected Balance Sheet Data ($000s) Liabilities Current Long-Term Total Liabilities Loans Liabilities Cash On Hand Assets Current Fixed Assets Assets Total Assets Shareholder Equity Beginning Stock Sale Earnings Equity (Purchase) Retained Ending Equity 2,644 132,397 373,374 505,771 6 0,800 149,000 209,800 261,458 -13,649 48,162 295,971 Weighted Dollar % of Total Tax Rate Weight Value Net Interest Rate Interest Rate Rate Debt Equity Selected Financial Statistics Profitability Measures Gross Operating Net Profit Profit Profit Margin Margin Margin Dividend Data Div. Per Total Div. Payout Share Payment terment of (S/share) (5000s) net profit) Credit Rating Measures Interest Debt to Default Risk Coverage Assets Risk of Ratio Ratio R atio Default Current Ratio Shares of Stock Days of Outstanding Inventory 000s of shares) 42.3% 16.4% 10.4% 0.05 978 2.0% 10.59 0.41 4.31 Low 2.18 65 days 19,550 Income Statement Data ($000s) Cost of Warehouse Marketing Admin Pairs Sold Expenses Expenses Expenses Net Sales Revenues Internet Wholesale P-label Operating Interest Income Profit Exp (Inc) Taxes Net Profit Total 111,112 344,008 0 473,759 273,356 48,916 57,567 16,403 77,517 7,317 21,060 49,140 Selected Balance Sheet Data ($000s) Liabilities Current Long-Term Total Liabilities Loans Liabilities Cash On Hand Assets Current Fixed Assets Assets Total Assets Shareholder Equity Beginning Stock Sale Earnings Equity (Purchase) Retained Ending Equity 2,644 132,397 373,374 505,771 6 0,800 149,000 209,800 261,458 -13,649 48,162 295,971 Weighted Dollar % of Total Tax Rate Weight Value Net Interest Rate Interest Rate Rate Debt Equity
Step by Step Solution
There are 3 Steps involved in it

Get step-by-step solutions from verified subject matter experts