

Question: What patterns do you observe in the figure below with the time series data presented? 700 600 500 400 M 100 0 Cycles Trend 20
What patterns do you observe in the figure below with the time series data presented? 700 600 500 400 M 100 0 Cycles Trend 20 Seasonality White Noise 40 wherhalte 60 80 100 120 140 160 4
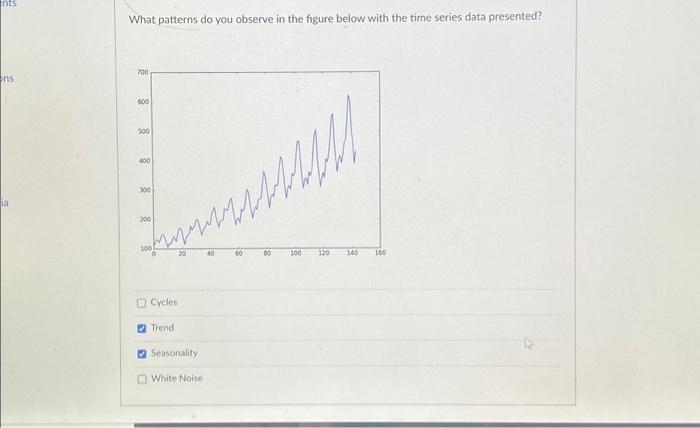
What patterns do you observe in the figure below with the time series data presented? Cyeles Trend Seasonality White Noise
Step by Step Solution
There are 3 Steps involved in it
1 Expert Approved Answer
Step: 1 Unlock

Question Has Been Solved by an Expert!
Get step-by-step solutions from verified subject matter experts
Step: 2 Unlock
Step: 3 Unlock