

Question: what should be my curve for this graph? L} ' ' HW S : 6.87 , 3.33 of 49 oints Homework: HW 5 Question 5,
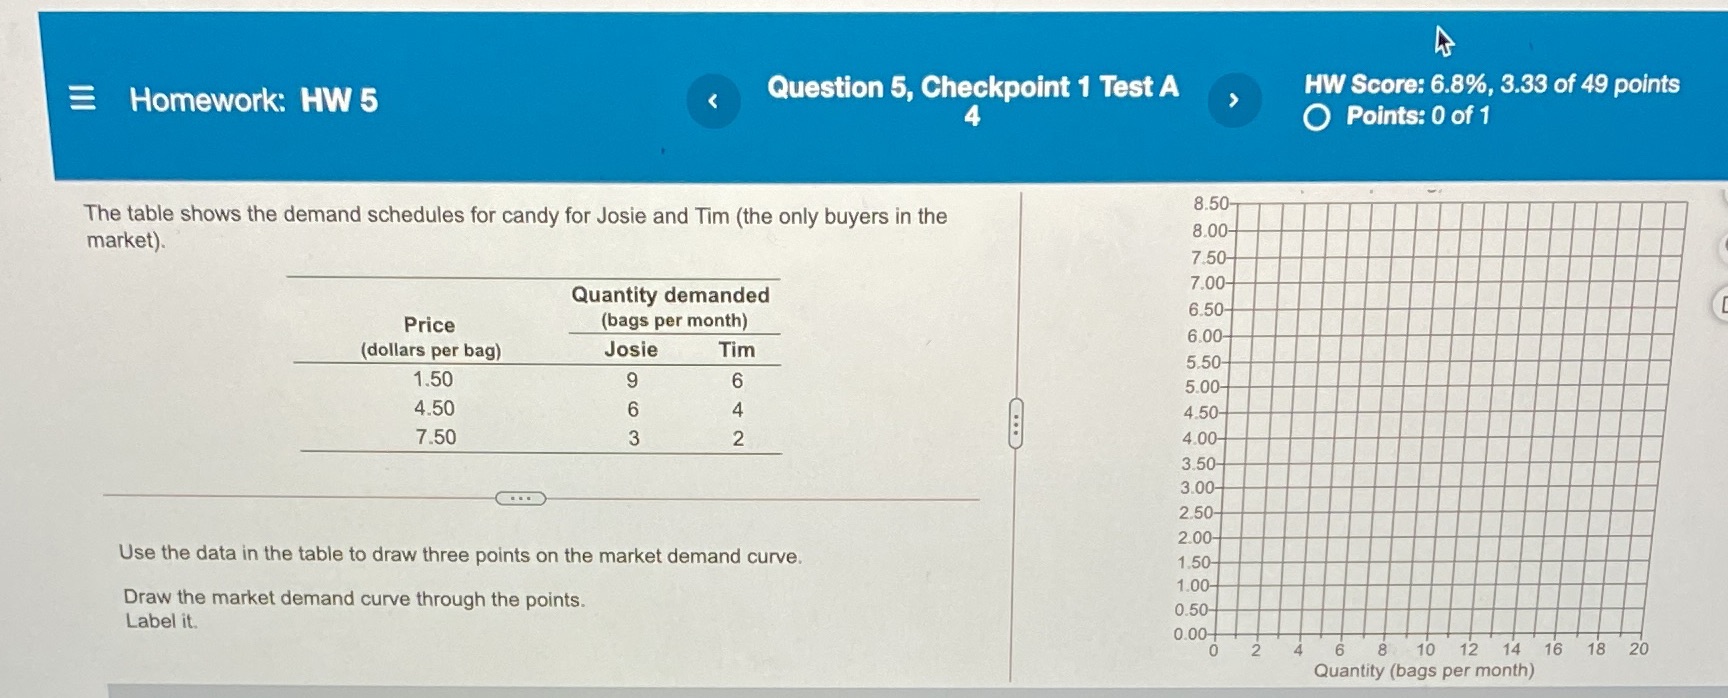
what should be my curve for this graph?

L} ' ' HW S : 6.87 , 3.33 of 49 oints Homework: HW 5 Question 5, Checkpomt 1 Test A core a p 4 0 Points: 0 of1 The table shows the demand schedules for candy for Josie and Turn (the only buyers in the market} Quantity demanded G Price (bugs per month) (doliarl per bag) Josle Tim 1.50 9 6 4.50 6 4 7.50 3 2 W Use the dam in the table to draw three points on the market demand curve. Draw \\he market demand curve through the points. Lube! 1L 0 2 4 6 8' 12 14 1'8 ' Quantity (bags per month) ' - 1a 1a 29
Step by Step Solution
There are 3 Steps involved in it
1 Expert Approved Answer
Step: 1 Unlock

Question Has Been Solved by an Expert!
Get step-by-step solutions from verified subject matter experts
Step: 2 Unlock
Step: 3 Unlock