

Question: What strategy did this company use based on the graphs? Financial Reports (Industry Overview) - ACC Price UAV Price PIQ Rating 10.0* $2260.00 7.5* $1720.00
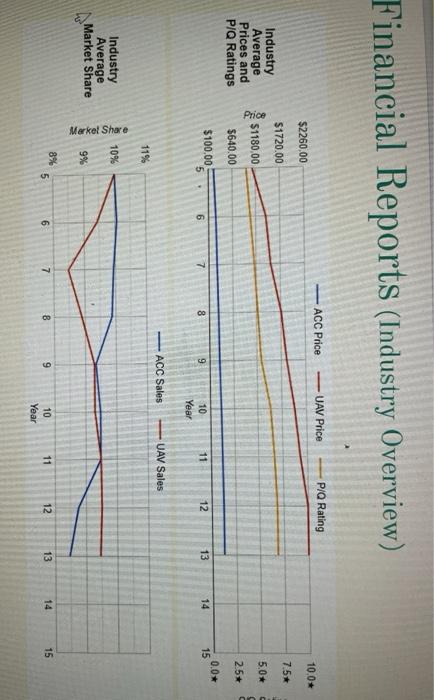
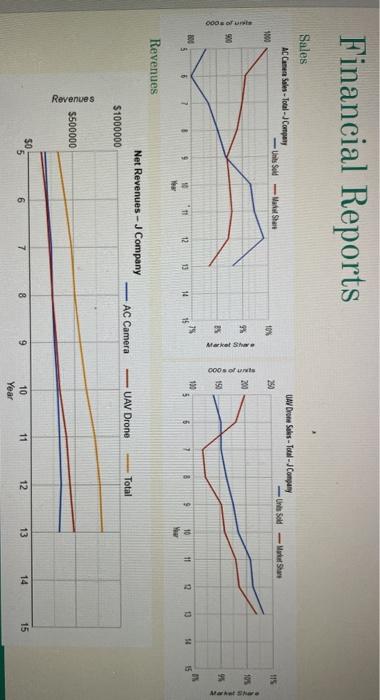
Financial Reports (Industry Overview) - ACC Price UAV Price PIQ Rating 10.0* $2260.00 7.5* $1720.00 5.0* $1180,00 Industry Average Prices and PIQ Ratings 2.5* $640.00 $100.00 5 0.0* 15 6 7 8 9 11 12 13 14 10 Year - ACC Sales UAV Sales 11% 10% Industry Average Market Share Merkel Share 9% 8% 5 6 7 8 9 11 12 13 14 15 10 Year Financial Reports Sales ACCames Sales - Total - Company -Unis Sold - Matt Share 1000 UAV Drone Sales - Total - Company -Un sold - Market 115 250 10 105 200 9% Os our Market Shwe 90 Marte 000 Ft 3% 190 IN 9 11 12 13 14 130 5 15 6 7 8 $ 11 16 We 14 -5 Revenues Net Revenues - J Company $1000000 AC Camera UAV Drone Total Revenues $500000 $0 5 6 7 8 9 11 12 13 14 15 10 Year
Step by Step Solution
There are 3 Steps involved in it

Get step-by-step solutions from verified subject matter experts