

Question: what syntax would I use to build a bubble plot in Rstudio ? My variables are: Expenditure, Income, Family Size, Male, City, Country in 10
what syntax would I use to build a bubble plot in Rstudio ? My variables are: Expenditure, Income, Family Size, Male, City, Country
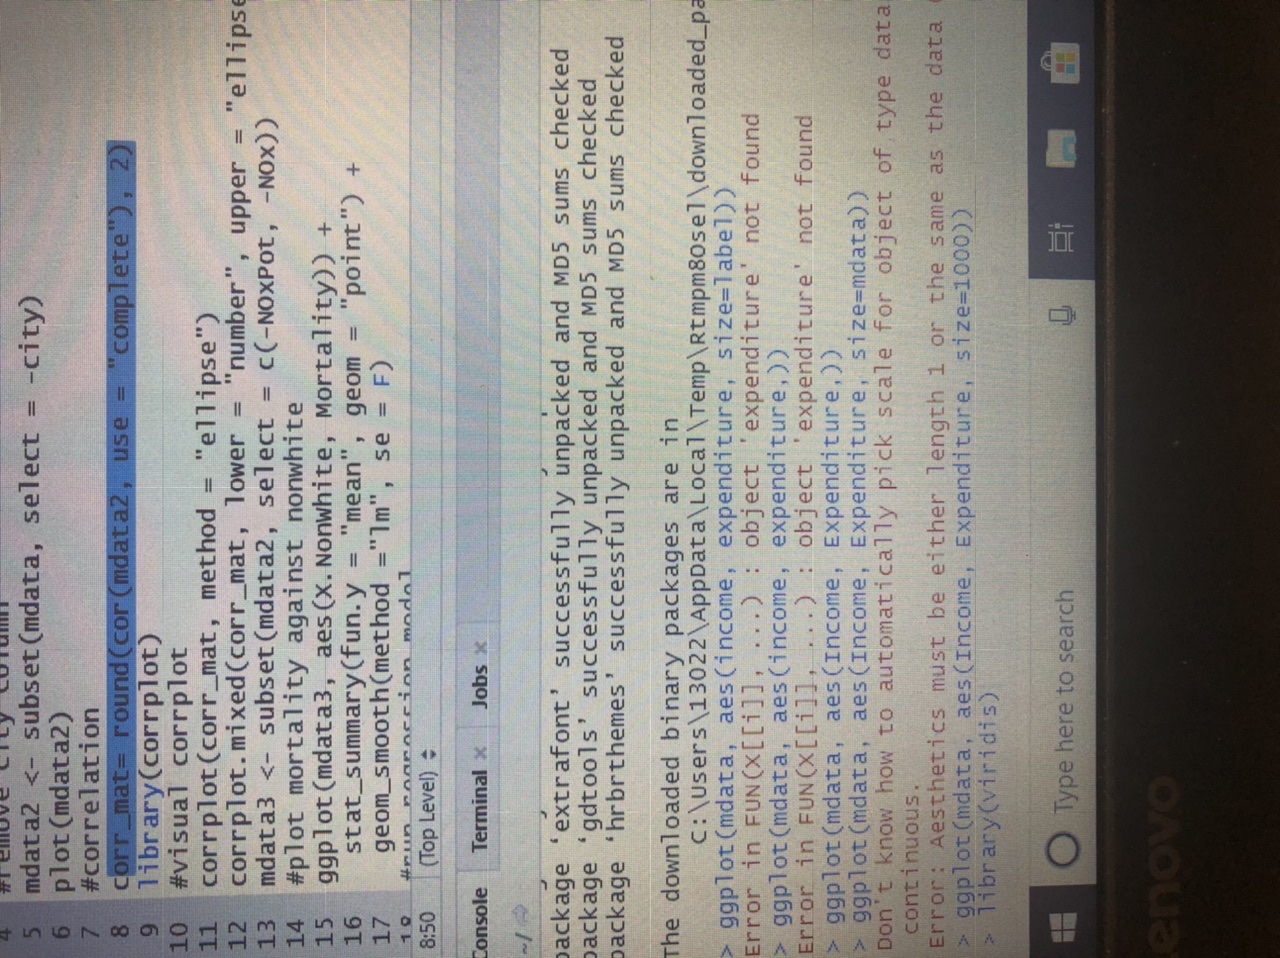
in 10 00 01 mdata2 ggplot (mdata, aes (Income, Expenditure, )) ggplot (mdata, aes (Income, Expenditure, size=mdata) ) Don't know how to automatically pick scale for object of type data continuous . Error : Aesthetics must be either length 1 or the same as the data ggplot (mdata, aes (Income, Expenditure, size=1000)) > library (viridis) O Type here to search enovo
Step by Step Solution
There are 3 Steps involved in it
1 Expert Approved Answer
Step: 1 Unlock

Question Has Been Solved by an Expert!
Get step-by-step solutions from verified subject matter experts
Step: 2 Unlock
Step: 3 Unlock