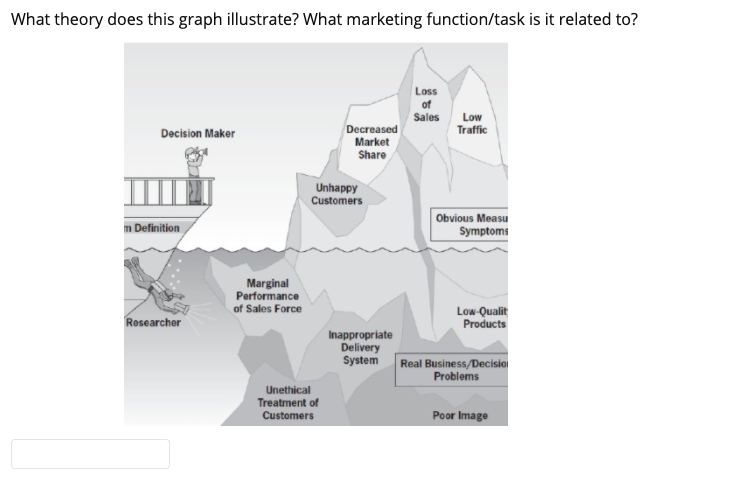
Question: What theory does this graph illustrate? What marketing function/task is it related to? Loss Sales Decision Maker Low Traffic Decreased Market Share Unhappy Customers m

What theory does this graph illustrate? What

What theory does this graph illustrate? What marketing function/task is it related to? Loss Sales Decision Maker Low Traffic Decreased Market Share Unhappy Customers m Definition Obvious Measu Symptoms Marginal Performance of Sales Force Researcher Low Qualit Products Inappropriate Delivery System Real Business/Decisio Problems Unethical Treatment of Customers Poor Image

Step by Step Solution

There are 3 Steps involved in it

1 Expert Approved Answer
Step: 1 Unlock blur-text-image
Question Has Been Solved by an Expert!

Get step-by-step solutions from verified subject matter experts

Step: 2 Unlock
Step: 3 Unlock

Students Have Also Explored These Related General Management Questions!