

Question: What variables can I compare between them to explain the financial development of China. In order to make 3 graphs with scatter plots. The picture
What variables can I compare between them to explain the financial development of China.
In order to make 3 graphs with scatter plots.
The picture is an example of what I would like to do.
use World Bank datasets:
- World Development indicators
-Worldwide governance indicators
- Global Financial Inclusion (Global Findex) Database
-Global financial development database
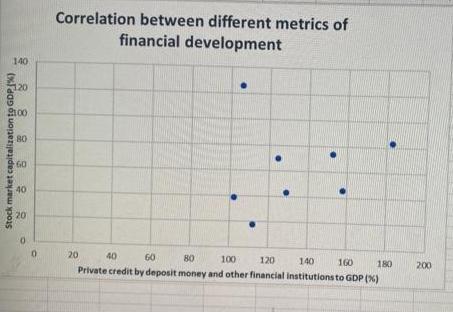
140 Stock market capitalization to GDP %) 120 2100 88888 80 60 40 20 0 0 Correlation between different metrics of financial development 20 40 60 80 100 120 140 160 180 Private credit by deposit money and other financial institutions to GDP (%) 200
Step by Step Solution
3.42 Rating (152 Votes )
There are 3 Steps involved in it
The answer provided below has been developed in a clear step by step manner Step 1 The financial dev... View full answer

Get step-by-step solutions from verified subject matter experts