

Question: What will be the expected future performance( three years average annual growth) for the next three years for ( sales%, earnings%, cash flow%, dividends%, and
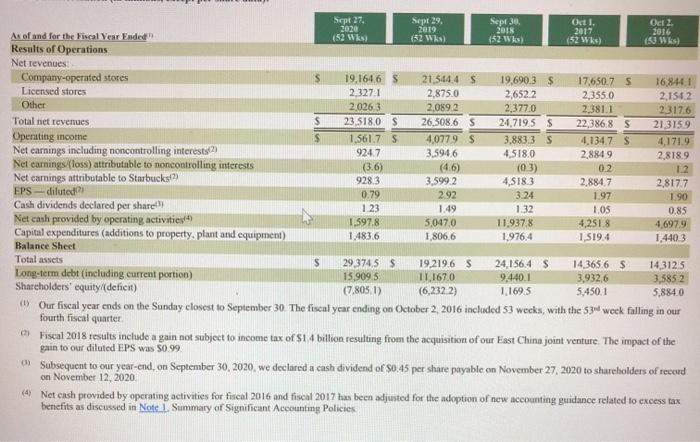
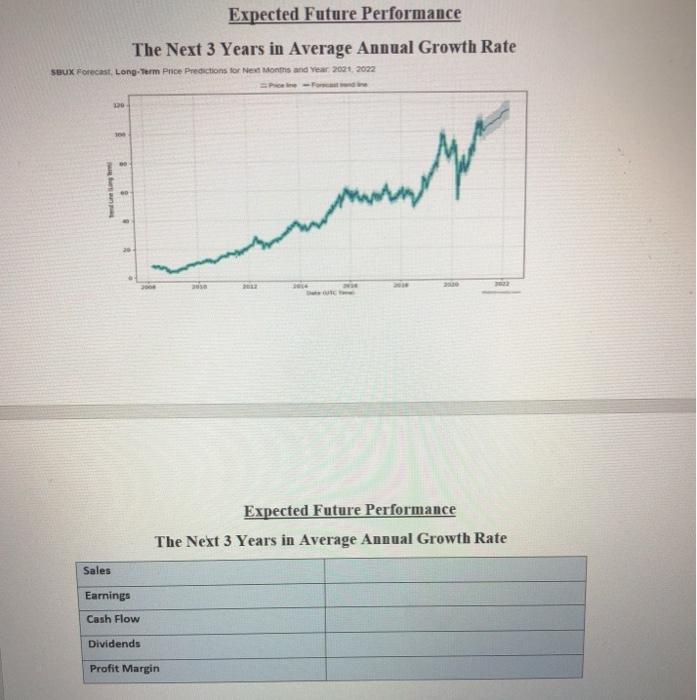
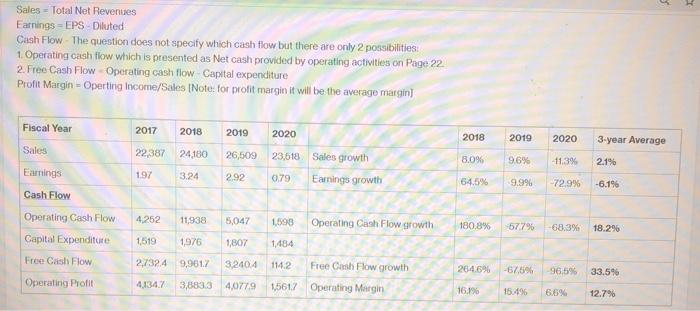
0.2 Sept 27. Sept 29. Sep 30, Okt , Oct 2 2020 2019 2018 2017 As of and for the Fiscal Year Ended 2016 (52 W (52 Wka) (52 Wks) (52 Wk) (50 ks) Results of Operations Net revenues Company-operated stores S 19,1646 S 21.5444 $ 19,690.3 $ 17.650.7 S 16,8441 Licensed stores 2,3271 2,875.0 2,6522 2,355.0 2,1542 Other 2,026,3 2,089.2 2,377.0 2,381.1 23176 Total net revenues S 23,518,0 S 26,508.6 S 24.7195 $ 22,3868 5 21 3159 Operating income S 1.561.7 S 4,0779 $ 3,883.3 $ 4.1347 $ 4.171.9 Net earnings including noncontrolling interest: 2 924 7 3,5946 4,518.0 2.8849 2.818.9 Net carningsloss) attributable to moncontrolling interests (36) (4.6) (0.3) 12 Net carnings attributable to Starbucks:2 928.3 3.599 2 4,518.3 2,884.7 2,817.7 EPS-diluted 0.79 292 3.24 197 1 90 Cash dividends declared per share!!! 123 1.49 1.32 1 OS 0.85 Net cash provided by operating activities 1.597.8 5,047.0 11,937,8 4,2518 4,6979 Capital expenditures (additions to property, plant and equipment) 1.483.6 1.806.6 1.976.4 1,5194 1.4403 Balance Sheet Total assets S 29 374,5 $ 19.219.6 S 24.156.4 $ 14,365,6 S 14,3125 Long-term debt (including current portion) 15,9095 11.1670 9,440.1 3,9326 3,5852 Shareholders' equity (deficit) (7.805.1) (6,2322) 1.169.5 5.450.1 5,884.0 (1) Our fiscal year ends on the Sunday closest to September 30. The fiscal year ending on October 2, 2016 included 53 weeks, with the 534 week falling in our fourth fiscal quarter Fiscal 2018 results include a gain not subject to income tax of $1.4 billion resulting from the acquisition of our East China joint venture. The impact of the gain to our diluted EPS was 5099 Subsequent to our year-end, on September 30, 2020, we declared a cash dividend of $0.45 per share payable on November 27, 2020 to shareholders of record on November 12, 2020 (4) Net cash provided by operating activities for fiscal 2016 and fiscal 2017 has been adjusted for the adoption of new accounting guidance related to excess tax benefits as discussed in Note Summary or Significant Accounting Policies Starbucks Coffee Company: The Starbucks Coffee Company features chain coffeehouse that are known for their coffee quality and their physical locations. The company offers standard coffee drinks and teas. However, in the past few years, the company has begun to interduce caffeinated beverages. In addition to caffeinated drinks, Starbucks Company also offers hot breakfast menu, juices, bakery items, packaged protein bowls, yogurt, and sandwiches. Starbucks was founded by Jerry Baldwin, Gordon Bowker, and Zev Siegl, and opening its first coffeehouse was founded in 1971 in Seattle, Washington. As the world's largest coffeehouse chain, Starbucks is seen to be main representation of the United States' second wave of coffee culture. Expected Future Performance The Next 3 Years in Average Annual Growth Rate SBUX Forecast, Long-Term Price Predictions for Next Months and Year 2021 2022 . Expected Future Performance The Next 3 Years in Average Annual Growth Rate Sales Earnings Cash Flow Dividends Profit Marin 0.2 Sept 27. Sept 29. Sep 30, Okt , Oct 2 2020 2019 2018 2017 As of and for the Fiscal Year Ended 2016 (52 W (52 Wka) (52 Wks) (52 Wk) (50 ks) Results of Operations Net revenues Company-operated stores S 19,1646 S 21.5444 $ 19,690.3 $ 17.650.7 S 16,8441 Licensed stores 2,3271 2,875.0 2,6522 2,355.0 2,1542 Other 2,026,3 2,089.2 2,377.0 2,381.1 23176 Total net revenues S 23,518,0 S 26,508.6 S 24.7195 $ 22,3868 5 21 3159 Operating income S 1.561.7 S 4,0779 $ 3,883.3 $ 4.1347 $ 4.171.9 Net earnings including noncontrolling interest: 2 924 7 3,5946 4,518.0 2.8849 2.818.9 Net carningsloss) attributable to moncontrolling interests (36) (4.6) (0.3) 12 Net carnings attributable to Starbucks:2 928.3 3.599 2 4,518.3 2,884.7 2,817.7 EPS-diluted 0.79 292 3.24 197 1 90 Cash dividends declared per share!!! 123 1.49 1.32 1 OS 0.85 Net cash provided by operating activities 1.597.8 5,047.0 11,937,8 4,2518 4,6979 Capital expenditures (additions to property, plant and equipment) 1.483.6 1.806.6 1.976.4 1,5194 1.4403 Balance Sheet Total assets S 29 374,5 $ 19.219.6 S 24.156.4 $ 14,365,6 S 14,3125 Long-term debt (including current portion) 15,9095 11.1670 9,440.1 3,9326 3,5852 Shareholders' equity (deficit) (7.805.1) (6,2322) 1.169.5 5.450.1 5,884.0 (1) Our fiscal year ends on the Sunday closest to September 30. The fiscal year ending on October 2, 2016 included 53 weeks, with the 534 week falling in our fourth fiscal quarter Fiscal 2018 results include a gain not subject to income tax of $1.4 billion resulting from the acquisition of our East China joint venture. The impact of the gain to our diluted EPS was 5099 Subsequent to our year-end, on September 30, 2020, we declared a cash dividend of $0.45 per share payable on November 27, 2020 to shareholders of record on November 12, 2020 (4) Net cash provided by operating activities for fiscal 2016 and fiscal 2017 has been adjusted for the adoption of new accounting guidance related to excess tax benefits as discussed in Note Summary or Significant Accounting Policies Starbucks Coffee Company: The Starbucks Coffee Company features chain coffeehouse that are known for their coffee quality and their physical locations. The company offers standard coffee drinks and teas. However, in the past few years, the company has begun to interduce caffeinated beverages. In addition to caffeinated drinks, Starbucks Company also offers hot breakfast menu, juices, bakery items, packaged protein bowls, yogurt, and sandwiches. Starbucks was founded by Jerry Baldwin, Gordon Bowker, and Zev Siegl, and opening its first coffeehouse was founded in 1971 in Seattle, Washington. As the world's largest coffeehouse chain, Starbucks is seen to be main representation of the United States' second wave of coffee culture. Expected Future Performance The Next 3 Years in Average Annual Growth Rate SBUX Forecast, Long-Term Price Predictions for Next Months and Year 2021 2022 . Expected Future Performance The Next 3 Years in Average Annual Growth Rate Sales Earnings Cash Flow Dividends Profit Marin
Step by Step Solution
There are 3 Steps involved in it

Get step-by-step solutions from verified subject matter experts