

Question: What would be my projection based on the numbers presented? Camera / Drone Operations in Europe-Africa AC Cameras Average Net Revenue ($ per unit) Units
What would be my projection based on the numbers presented?
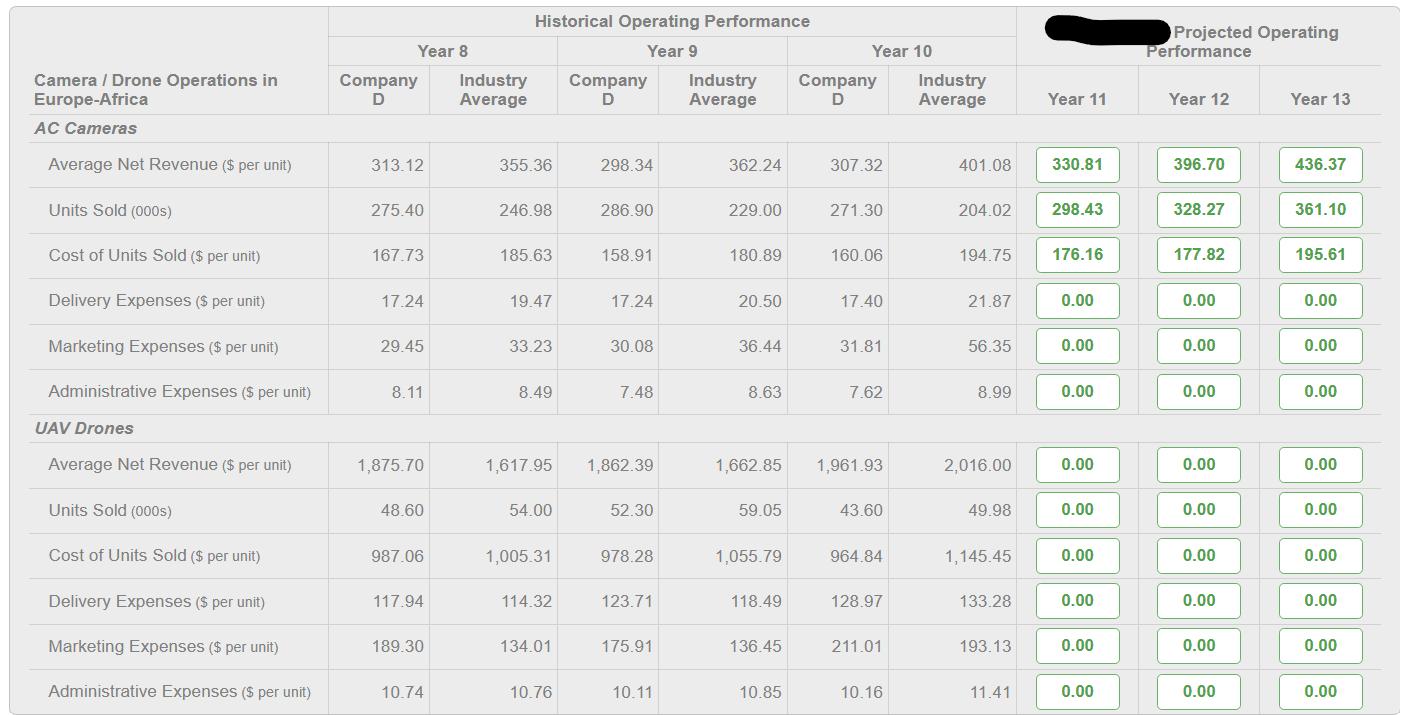
Camera / Drone Operations in Europe-Africa AC Cameras Average Net Revenue ($ per unit) Units Sold (000s) Cost of Units Sold ($ per unit) Delivery Expenses ($ per unit) Marketing Expenses ($ per unit) Administrative Expenses ($ per unit) UAV Drones Average Net Revenue ($ per unit) Units Sold (000s) Cost of Units Sold ($ per unit) Delivery Expenses ($ per unit) Marketing Expenses ($ per unit) Administrative Expenses ($ per unit) Year 8 Company D 313.12 275.40 167.73 17.24 29.45 8.11 1,875.70 48.60 987.06 117.94 189.30 10.74 Industry Average Historical Operating Performance Year 9 355.36 246.98 185.63 19.47 33.23 8.49 1,617.95 54.00 1,005.31 114.32 134.01 10.76 Company Industry Company Industry Average D D Average 298.34 286.90 158.91 17.24 30.08 7.48 1,862.39 52.30 978.28 123.71 175.91 10.11 362.24 229.00 180.89 20.50 36.44 8.63 1,662.85 59.05 1,055.79 118.49 136.45 Year 10 10.85 307.32 271.30 160.06 17.40 31.81 7.62 1,961.93 43.60 964.84 128.97 211.01 10.16 401.08 204.02 194.75 21.87 56.35 8.99 2,016.00 49.98 1,145.45 133.28 193.13 11.41 Year 11 330.81 298.43 176.16 0.00 0.00 0.00 0.00 0.00 0.00 0.00 0.00 0.00 Projected Operating Performance Year 12 396.70 328.27 177.82 0.00 0.00 0.00 0.00 0.00 0.00 0.00 0.00 0.00 Year 13 436.37 361.10 195.61 0.00 0.00 0.00 0.00 0.00 0.00 0.00 0.00 0.00
Step by Step Solution
There are 3 Steps involved in it
The data seems to represent a forecast of corporation Ds operational performance in the EuropeAfrica ... View full answer

Get step-by-step solutions from verified subject matter experts