

Question: What would be the Answer to Assignment 1A? BASE CASE $1 $1 $1 $1 0.20 0.0350 0.0450 0.0475 0.0050 0.0075 1 FUND MANAGER INVESTMENT MIX
What would be the Answer to Assignment 1A?
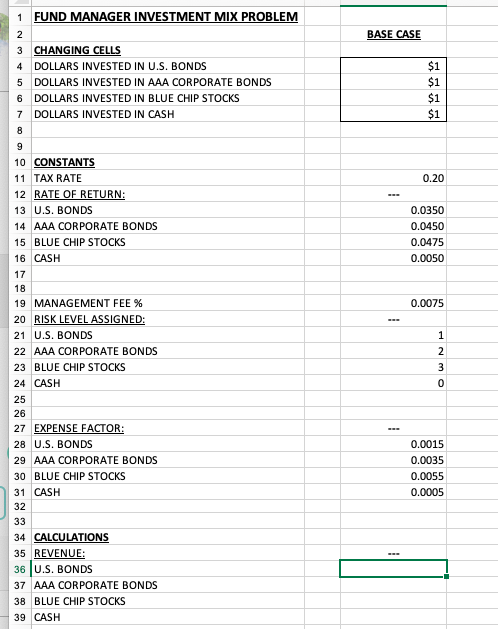
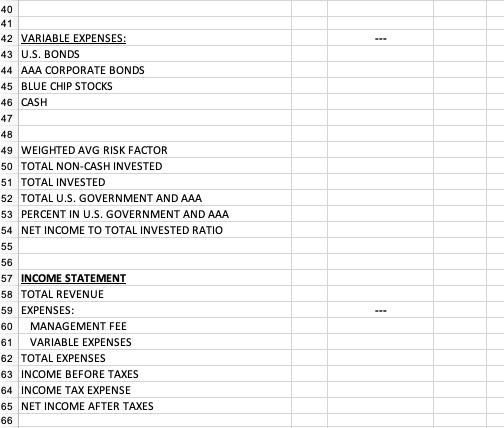
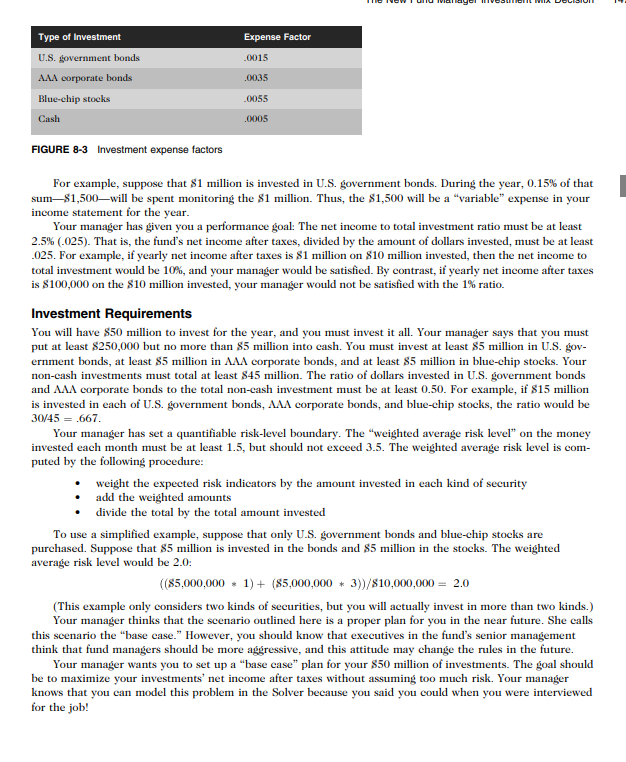
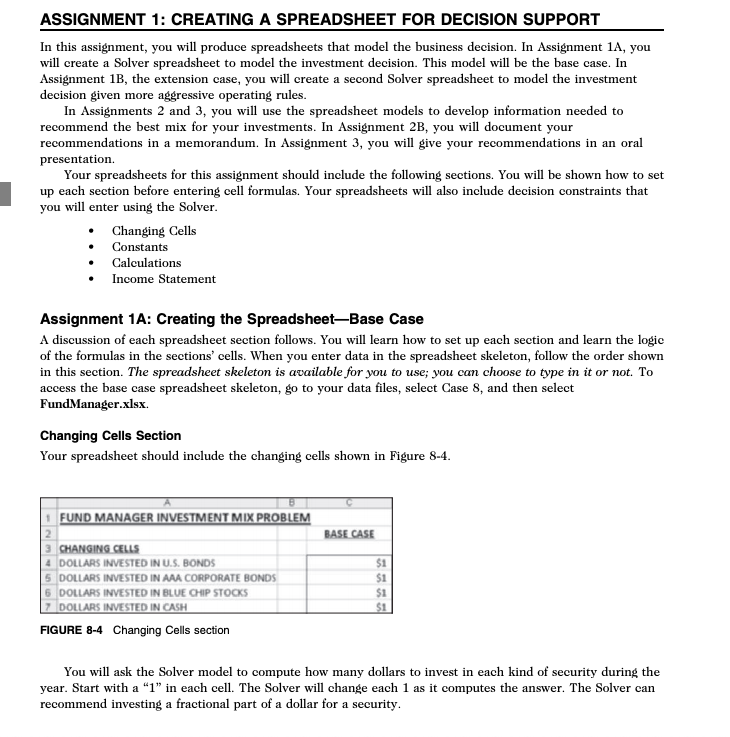
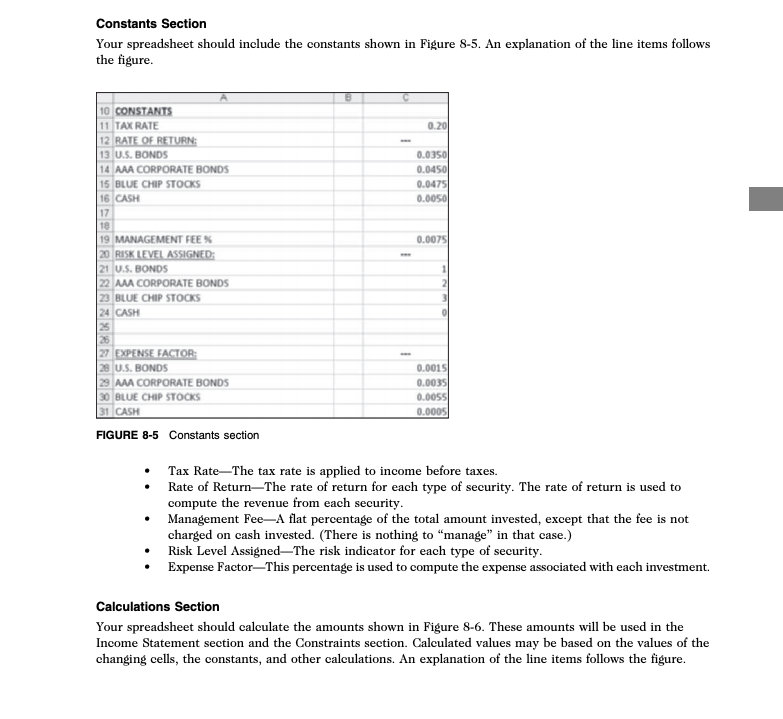
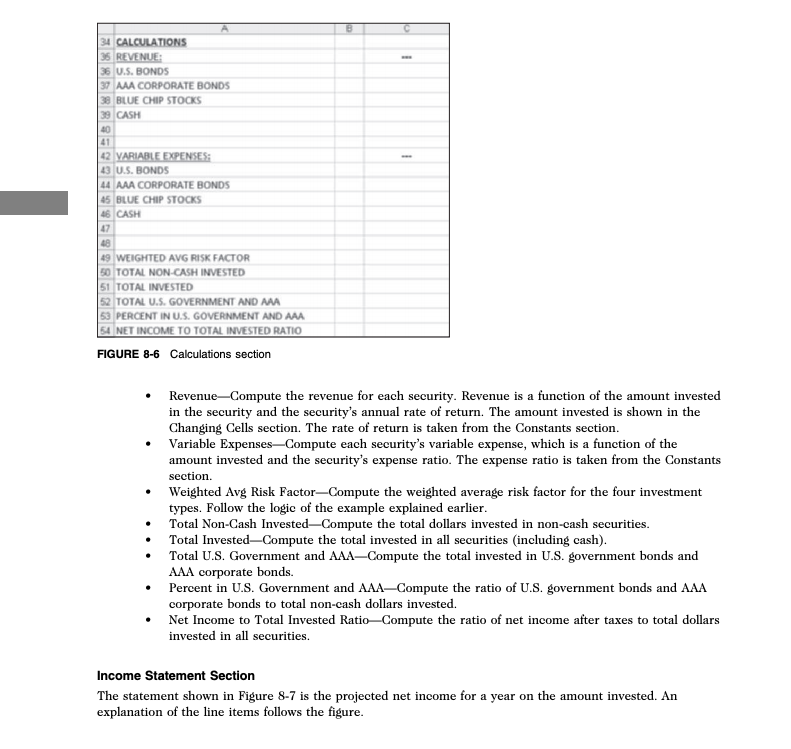
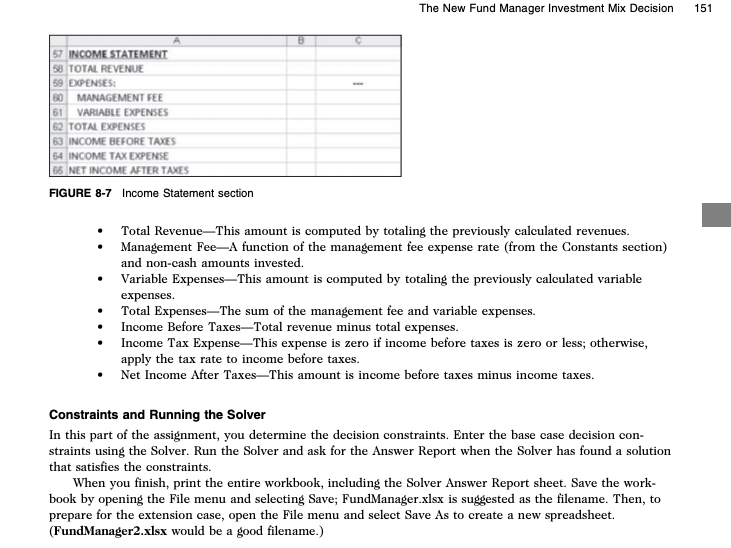
BASE CASE $1 $1 $1 $1 0.20 0.0350 0.0450 0.0475 0.0050 0.0075 1 FUND MANAGER INVESTMENT MIX PROBLEM 2 3 CHANGING CELLS 4 DOLLARS INVESTED IN U.S. BONDS 5 DOLLARS INVESTED IN AAA CORPORATE BONDS 6 DOLLARS INVESTED IN BLUE CHIP STOCKS 7 DOLLARS INVESTED IN CASH 8 9 10 CONSTANTS 11 TAX RATE 12 RATE OF RETURN: 13 U.S. BONDS 14 AAA CORPORATE BONDS 15 BLUE CHIP STOCKS 16 CASH 17 18 19 MANAGEMENT FEE % 20 RISK LEVEL ASSIGNED: 21 U.S. BONDS 22 AAA CORPORATE BONDS 23 BLUE CHIP STOCKS 24 CASH 25 26 27 EXPENSE FACTOR: 28 U.S. BONDS 29 AAA CORPORATE BONDS 30 BLUE CHIP STOCKS 31 CASH 32 33 34 CALCULATIONS 35 REVENUE: 36 U.S. BONDS 37 AAA CORPORATE BONDS 38 BLUE CHIP STOCKS 39 CASH 1 2 3 0.0015 0.0035 0.0055 0.0005 1 40 41 42 VARIABLE EXPENSES: 43 U.S. BONDS 44 AAA CORPORATE BONDS 45 BLUE CHIP STOCKS 46 CASH 47 48 49 WEIGHTED AVG RISK FACTOR 50 TOTAL NON-CASH INVESTED 51 TOTAL INVESTED 52 TOTAL U.S. GOVERNMENT AND AAA 53 PERCENT IN U.S. GOVERNMENT AND AAA 54 NET INCOME TO TOTAL INVESTED RATIO 55 56 57 INCOME STATEMENT 58 TOTAL REVENUE 59 EXPENSES: 60 MANAGEMENT FEE 61 VARIABLE EXPENSES 62 TOTAL EXPENSES 63 INCOME BEFORE TAXES 64 INCOME TAX EXPENSE 65 NET INCOME AFTER TAXES 66 CASE 8 THE NEW FUND MANAGER INVESTMENT MIX DECISION Decision Support Using Excel Solver PREVIEW You are a new investment manager working for a giant mutual fund. You will have $50 million to invest. You want to buy securities that are profitable but safe. In this case, you will use Excel to determine the best mix of securities to buy for your fund. PREPARATION Review spreadsheet concepts discussed in class and in your textbook. Complete any exercises that your instructor assigns. Complete any part of Tutorial D that your instructor assigns, or refer to Tutorial D as necessary. Review file-saving procedures for Windows programs, as discussed in Tutorial C. Refer to Tutorials E and F as necessary. BACKGROUND You work for a gigantic mutual fund that manages billions of dollars. The money is parceled out to its invest- ment managers to be invested. Managers who invest well are retained by the company. You have recently been appointed as an investment manager, and you will have $50 million to invest for the year. You want to consider the following kinds of investments: Bonds issued by the U.S. governmentThese bonds earn interest and are considered very safe, because the government has a printing press and can always repay its debts. AAA corporate bondsThese bonds earn interest. The credit worthiness of corporations is rated. "AAA" is the highest rating in the markets, so these bonds are considered very safe. Blue chip common stocksShares of common stock represent ownership in corporations. Blue chip" corporations such as General Electric are considered the most successful companies. Cash-Cash invested in money market instruments does not earn much interest, but holding cash is considered extremely safe. Rates of Return and Risk Each kind of security has an expected "rate of return and an expected level of risk. Assume that the rate of return is one of the following: The amount of cash received by the investor (in dividends or interest) divided by the cost of the investment The increase in the security's market price divided by the cost of the investment Investors who seek higher rates of return must assume higher levels of risk. When the market value of a stock or bond falls after being purchased, the decrease is called a loss of principal. For example, suppose 146 Case 8 that an investor buys 1,000 shares of ABC stock at $80 dollars per share. If ABC shares then fall to $10 per share, the loss of principal is 1,000 times 870, or a loss of $70,000. You understand that an investor who faces a higher level of risk will demand a higher rate of return. Your fund's Research Department has estimated the expected annual rate of return for the three kinds of securities and for cash. The rates are shown in Figure 8-1. Expected Rate of Return .0350 Type of Investment U.S. government bonds AAA corporate bonds Blue-chip stocks .0450 .0475 Cash .0050 FIGURE 8-1 Expected rates of retum For example, suppose that $1 million is invested in U.S. government bonds. During the year, 3.5% of that amount_$35,000will be received on that investment. That $35,000 will be "revenue" in the income state- ment. As another example, suppose that $1 million is invested in blue-chip stocks. If the prices of the stocks go up an average of 4.75% per year, the increase will yield $47,500 of revenue in the income statement. Notice that the rates of return cited here are annual rates. The fund's Research Department has investment managers assigned to monitor the expected levels of risk for different kinds of securities. Risk is denoted by a numerical Expected Risk Indicator. The greater this number is, the higher the risk of losses. The expected risk indicators are shown in Figure 8-2. Expected Risk Indicator 1 Type of Investment U.S. government bonds AAA corporate bonds Blue-chip stocks Cash 2 3 0 FIGURE 8-2 Expected risk indicators As shown in Figure 8-2, U.S. government bonds have very low risk because the government can be expected to repay its debts (though the market value of any bond can decline). AAA corporate bonds have some risk, but not much, because the best companies almost always pay their debts. Blue-chip stocks carry some riskthe risk on stock prices is generally higher than on bond prices. There is almost no risk of losing cash that is invested in money-market instruments, so zero risk is assumed. Expenses Operating the mutual fund generates two kinds of expenses. First, the fund must work with a separate mar agement company that keeps financial records on computers, provides frequent data and reports from Wall Street, and so on. Your fund's management company charges three-quarters of one percent of the amount invested in non-cash securities. For example, if you invested 549 million in non-cash securities, you would incur a management fee of 0.0075 849,000,000. Second, you and your analysts must watch each kind of security. The cost of this activity (salaries, office expenses, and so on) depends on the kind of security. Assume that high-risk securities require more over- sight, so the expenses associated with a high-risk security are greater than those for a low-risk security. The fund's Research Department has estimated the expense factors for securities and cash (see Figure 8-3). Expense Factor .0015 Type of Investment U.S. government bonds AAA corporate bonds Blue-chip stocks Cash .0035 .0055 .0005 FIGURE 8-3 Investment expense factors For example, suppose that $1 million is invested in U.S. government bonds. During the year, 0.15% of that sum$1,500will be spent monitoring the $1 million. Thus, the $1,500 will be a "variable expense in your income statement for the year. Your manager has given you a performance goal: The net income to total investment ratio must be at least 2.5% (.025). That is the funds net income after taxes, divided by the amount of dollars invested, must be at least .025. For example, if yearly net income after taxes is $1 million on $10 million invested, then the net income to total investment would be 10%, and your manager would be satisfied. By contrast, if yearly net income after taxes is $100,000 on the $10 million invested, your manager would not be satisfied with the 1% ratio. Investment Requirements You will have $50 million to invest for the year, and you must invest it all. Your manager says that you must put at least 8250,000 but no more than $5 million into cash. You must invest at least $5 million in U.S.gov- ernment bonds, at least $5 million in AAA corporate bonds, and at least $5 million in blue-chip stocks. Your non-cash investments must total at least 845 million. The ratio of dollars invested in U.S. government bonds and AAA corporate bonds to the total non-cash investment must be at least 0.50. For example, if $15 million is invested in each of U.S. government bonds, AAA corporate bonds, and blue-chip stocks, the ratio would be 30/45 = .667 Your manager has set a quantifiable risk-level boundary. The "weighted average risk level" on the money invested each month must be at least 1.5, but should not exceed 3.5. The weighted average risk level is com- puted by the following procedure: weight the expected risk indicators by the amount invested in each kind of security add the weighted amounts divide the total by the total amount invested To use a simplified example, suppose that only U.S. government bonds and blue-chip stocks are purchased. Suppose that $5 million is invested in the bonds and $5 million in the stocks. The weighted average risk level would be 2.0: (($5,000,000 1) + ($5,000,000 + 3}}/$10,000,000 = 2.0 (This example only considers two kinds of securities, but you will actually invest in more than two kinds.) Your manager thinks that the scenario outlined here is a proper plan for you in the near future. She calls this scenario the base case." However, you should know that executives in the fund's senior management think that fund managers should be more aggressive, and this attitude may change the rules in the future. Your manager wants you to set up a "base case" plan for your $50 million of investments. The goal should be to maximize your investments' net income after taxes without assuming too much risk. Your manager knows that you can model this problem in the Solver because you said you could when you were interviewed for the job! ASSIGNMENT 1: CREATING A SPREADSHEET FOR DECISION SUPPORT In this assignment, you will produce spreadsheets that model the business decision. In Assignment 1A, you will create a Solver spreadsheet to model the investment decision. This model will be the base case. In Assignment 1B, the extension case, you will create a second Solver spreadsheet to model the investment decision given more aggressive operating rules. In Assignments 2 and 3, you will use the spreadsheet models to develop information needed to recommend the best mix for your investments. In Assignment 2B, you will document your recommendations in a memorandum. In Assignment 3, you will give your recommendations in an oral presentation. Your spreadsheets for this assignment should include the following sections. You will be shown how to set up each section before entering cell formulas. Your spreadsheets will also include decision constraints that you will enter using the Solver. Changing Cells Constants Calculations Income Statement Assignment 1A: Creating the Spreadsheet-Base Case A discussion of each spreadsheet section follows. You will learn how to set up each section and learn the logic of the formulas in the sections' cells. When you enter data in the spreadsheet skeleton, follow the order shown in this section. The spreadsheet skeleton is available for you to use; you can choose to type in it or not. To access the base case spreadsheet skeleton, go to your data files, select Case 8, and then select Fund Manager.xlsx Changing Cells Section Your spreadsheet should include the changing cells shown in Figure 8-4. BASE CASE 1 FUND MANAGER INVESTMENT MIX PROBLEM 2 3 CHANGING CELLS 4 DOLLARS INVESTED IN U.S. BONDS 5 DOLLARS INVESTED IN AAA CORPORATE BONDS 5 DOLLARS INVESTED IN BLUE CHIP STOCKS 7 DOLLARS INVESTED IN CASH FIGURE 8-4 Changing Cells section $1 $1 $1 $1 You will ask the Solver model to compute how many dollars to invest in each kind of security during the year. Start with a "1" in each cell. The Solver will change each 1 as it computes the answer. The Solver can recommend investing a fractional part of a dollar for a security. Constants Section Your spreadsheet should include the constants shown in Figure 8-5. An explanation of the line items follows the figure. 0.20 0.03501 0.0450 0.04751 0.00501 10 CONSTANTS 11 TAX RATE 12 RATE OF RETURN 13 U.S. BONDS 14 AAA CORPORATE BONDS 15 BLUE CHIP STOCKS 16 CASH 17 18 19 MANAGEMENT FEEX 20 RISK LEVEL ASSIGNED 21 U.S. BONDS 22 MA CORPORATE BONDS 23 BLUE CHIP STOCKS 24 CASH 0.00751 26 27 EXPENSE FACTOR: 28 U.S.BONDS AAA CORPORATE BONDS 30 BLUE CHIP STOCKS 31 CASH FIGURE 8-5 Constants section 0.0015 0.0035 0.00551 0.0005 Tax RateThe tax rate is applied to income before taxes. Rate of ReturnThe rate of return for each type of security. The rate of return is used to compute the revenue from each security. Management Fee-A flat percentage of the total amount invested, except that the fee is not charged on cash invested. (There is nothing to "manage" in that case.) Risk Level Assigned-The risk indicator for each type of security. Expense FactorThis percentage is used to compute the expense associated with each investment. Calculations Section Your spreadsheet should calculate the amounts shown in Figure 8-6. These amounts will be used in the Income Statement section and the Constraints section. Calculated values may be based on the values of the changing cells, the constants, and other calculations. An explanation of the line items follows the figure. 1 34 CALCULATIONS REVENUE: 36 U.S. BONDS 37 AAA CORPORATE BONDS BLUE CHIP STOCKS 39 CASH 41 VARIABLE EXPENSES: 43 U.S. BONDS 44 AAA CORPORATE BONDS 45 BLUE CHIP STOCKS 46 CASH 18 49 WEIGHTED AVG RISK FACTOR 50 TOTAL NON-CASH INVESTED 51 TOTAL INVESTED 52 TOTAL U.S. GOVERNMENT AND AAA 53 PERCENT IN U.S. GOVERNMENT AND AAA NET INCOME TO TOTAL INVESTED RATIO FIGURE 8-6 Calculations section Revenue-Compute the revenue for each security. Revenue is a function of the amount invested in the security and the security's annual rate of return. The amount invested is shown in the Changing Cells section. The rate of return is taken from the Constants section. Variable Expenses Compute each security's variable expense, which is a function of the amount invested and the security's expense ratio. The expense ratio is taken from the Constants section. Weighted Avg Risk FactorCompute the weighted average risk factor for the four investment types. Follow the logic of the example explained earlier. Total Non-Cash Invested-Compute the total dollars invested in non-cash securities. Total Invested Compute the total invested in all securities (including cash). Total U.S. Government and AAA-Compute the total invested in U.S. government bonds and AAA corporate bonds. Percent in U.S. Government and AAACompute the ratio of U.S. government bonds and AAA corporate bonds to total non-cash dollars invested. Net Income to Total Invested RatioCompute the ratio of net income after taxes to total dollars invested in all securities. Income Statement Section The statement shown in Figure 8-7 is the projected net income for a year on the amount invested. An explanation of the line items follows the figure. The New Fund Manager Investment Mix Decision 151 B 57 INCOME STATEMENT 58 TOTAL REVENUE 59 EXPENSES: 80 MANAGEMENT FEE 61 VARIABLE EXPENSES 62 TOTAL EXPENSES 63 INCOME BEFORE TAXES 54 INCOME TAX EXPENSE 65 NET INCOME AFTER TAXES FIGURE 8-7 Income Statement section Total Revenue-This amount is computed by totaling the previously calculated revenues. Management Fee-A function of the management fee expense rate (from the Constants section) and non-cash amounts invested. Variable ExpensesThis amount is computed by totaling the previously calculated variable expenses. Total ExpensesThe sum of the management fee and variable expenses. Income Before TaxesTotal revenue minus total expenses. Income Tax Expense This expense is zero if income before taxes is zero or less; otherwise, apply the tax rate to income before taxes. Net Income After TaxesThis amount is income before taxes minus income taxes. Constraints and Running the Solver In this part of the assignment, you determine the decision constraints. Enter the base case decision con- straints using the Solver. Run the Solver and ask for the Answer Report when the Solver has found a solution that satisfies the constraints. When you finish, print the entire workbook, including the Solver Answer Report sheet. Save the work- book by opening the File menu and selecting Save; FundManager.xlsx is suggested as the filename. Then, to prepare for the extension case, open the File menu and select Save As to create a new spreadsheet. (FundManager2.xlsx would be a good filename.)
Step by Step Solution
There are 3 Steps involved in it

Get step-by-step solutions from verified subject matter experts