

Question: What would you adjust to this model and why? Recreate model in XLS and paste the answer here. 83.3% QUICK EVALUATION (Back of the Envelope
-
What would you adjust to this model and why? Recreate model in XLS and paste the answer here.
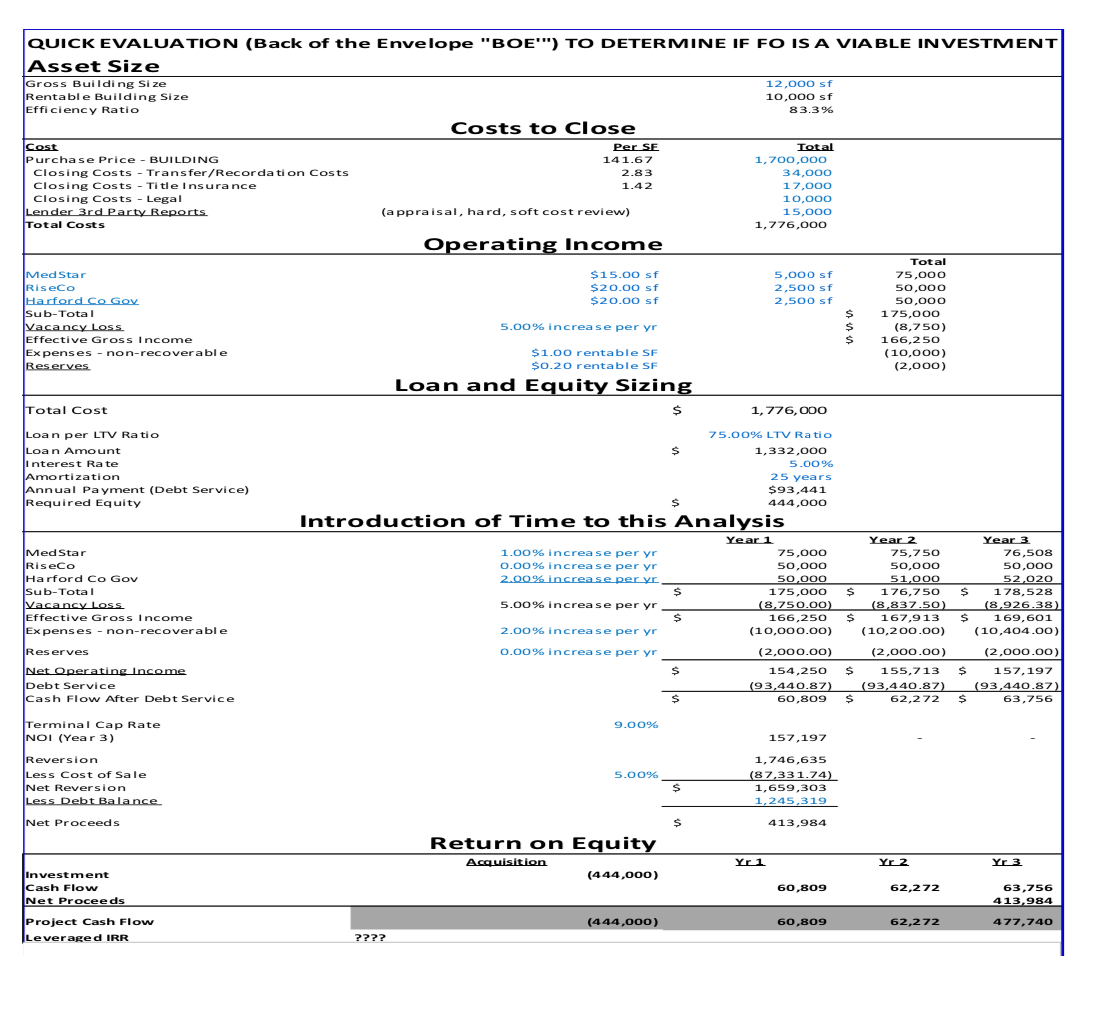
83.3% QUICK EVALUATION (Back of the Envelope "BOE"") TO DETERMINE IF FO IS A VIABLE INVESTMENT Asset Size Gross Building Size 12,000 sf Rentable Building Size 10,000 sf Efficiency Ratio Costs to close Cost Per SE Total Purchase Price - BUILDING 141.67 1,700,000 Closing Costs - Transfer/Recordation Costs 2.83 34,000 Closing Costs - Title insurance 1.42 17,000 Closing Costs - Legal 10,000 Lender 3rd Party Reports (appraisal, hard, soft cost review) , 15,000 Total Costs 1,776,000 Operating Income Total Med Star $15.00 sf 5,000 sf 75,000 Riseco $20.00 sf 2,500 sf 50,000 Harford Co Goy $20.00 sf 2,500 sf 50,000 Sub-Total $ 175,000 Vacancy LOSS 5.00% increase per yr $ (8,750) Effective Gross Income $ 166,250 Expenses - non-recoverable $1.00 rentable SF (10,000) Reserves $0.20 rentable SF (2,000) Loan and Equity Sizing Total Cost $ 1,776,000 $ Loan per LTV Ratio Loan Amount interest Rate Amortization Annual Payment (Debt Service) Required Equity 75.00% LTV Ratio 1,332,000 5.00% 25 years $93,441 444,000 Introduction of Time to this Analysis Year 1 1.00% increase per yr 0.00% increase per yr y Med Star Riseco Harford Co Gov Sub-Total Vacancy Loss Effective Gross income Expenses - non-recoverable 75,000 50,000 50,000 175,000 (8,750.00) 166,250 (10,000.00) $ Year 3 76,508 50,000 52,020 $ 178,528 (8,926.38) $ 169,601 (10,404.00) 5.00% increase per yr $ Year 2 75,750 50,000 51,000 $ 176,750 (8,837.50) $ 167,913 (10,200.00) (2,000.00) $ 155,713 (93,440.87) $ 62,272 2.00% increase per yr 0.00% increase per yr (2,000.00) $ Reserves Net Operating Income Debt Service Cash Flow After Debt Service 154,250 (93,440.87) 60,809 (2,000.00) $ 157,197 (93,440.87) $ $ 63,756 S 9.00% Terminal Cap Rate NOI (Year 3) 157.197 5.00% Reversion Less Cost of Sale Net Reversion Less Debt Balance Net Proceeds 1,746,635 (87,331.74) 1,659,303 1,245,319 $ $ 413,984 Return on Equity Acquisition (444,000) Yr1 Yr 2 Yr 3 Investment Cash Flow Net Proceeds 60,809 62,272 63,756 413,984 (444,000) 60,809 62,272 Project Cash Flow Leveraged IRR 477,740 ???? 83.3% QUICK EVALUATION (Back of the Envelope "BOE"") TO DETERMINE IF FO IS A VIABLE INVESTMENT Asset Size Gross Building Size 12,000 sf Rentable Building Size 10,000 sf Efficiency Ratio Costs to close Cost Per SE Total Purchase Price - BUILDING 141.67 1,700,000 Closing Costs - Transfer/Recordation Costs 2.83 34,000 Closing Costs - Title insurance 1.42 17,000 Closing Costs - Legal 10,000 Lender 3rd Party Reports (appraisal, hard, soft cost review) , 15,000 Total Costs 1,776,000 Operating Income Total Med Star $15.00 sf 5,000 sf 75,000 Riseco $20.00 sf 2,500 sf 50,000 Harford Co Goy $20.00 sf 2,500 sf 50,000 Sub-Total $ 175,000 Vacancy LOSS 5.00% increase per yr $ (8,750) Effective Gross Income $ 166,250 Expenses - non-recoverable $1.00 rentable SF (10,000) Reserves $0.20 rentable SF (2,000) Loan and Equity Sizing Total Cost $ 1,776,000 $ Loan per LTV Ratio Loan Amount interest Rate Amortization Annual Payment (Debt Service) Required Equity 75.00% LTV Ratio 1,332,000 5.00% 25 years $93,441 444,000 Introduction of Time to this Analysis Year 1 1.00% increase per yr 0.00% increase per yr y Med Star Riseco Harford Co Gov Sub-Total Vacancy Loss Effective Gross income Expenses - non-recoverable 75,000 50,000 50,000 175,000 (8,750.00) 166,250 (10,000.00) $ Year 3 76,508 50,000 52,020 $ 178,528 (8,926.38) $ 169,601 (10,404.00) 5.00% increase per yr $ Year 2 75,750 50,000 51,000 $ 176,750 (8,837.50) $ 167,913 (10,200.00) (2,000.00) $ 155,713 (93,440.87) $ 62,272 2.00% increase per yr 0.00% increase per yr (2,000.00) $ Reserves Net Operating Income Debt Service Cash Flow After Debt Service 154,250 (93,440.87) 60,809 (2,000.00) $ 157,197 (93,440.87) $ $ 63,756 S 9.00% Terminal Cap Rate NOI (Year 3) 157.197 5.00% Reversion Less Cost of Sale Net Reversion Less Debt Balance Net Proceeds 1,746,635 (87,331.74) 1,659,303 1,245,319 $ $ 413,984 Return on Equity Acquisition (444,000) Yr1 Yr 2 Yr 3 Investment Cash Flow Net Proceeds 60,809 62,272 63,756 413,984 (444,000) 60,809 62,272 Project Cash Flow Leveraged IRR 477,740
Step by Step Solution
There are 3 Steps involved in it

Get step-by-step solutions from verified subject matter experts