

Question: What's the answer for question b K The accompanying scatterplot shows the median weekly earnings (by quarter) for men '6 ' and women in a
What's the answer for question b
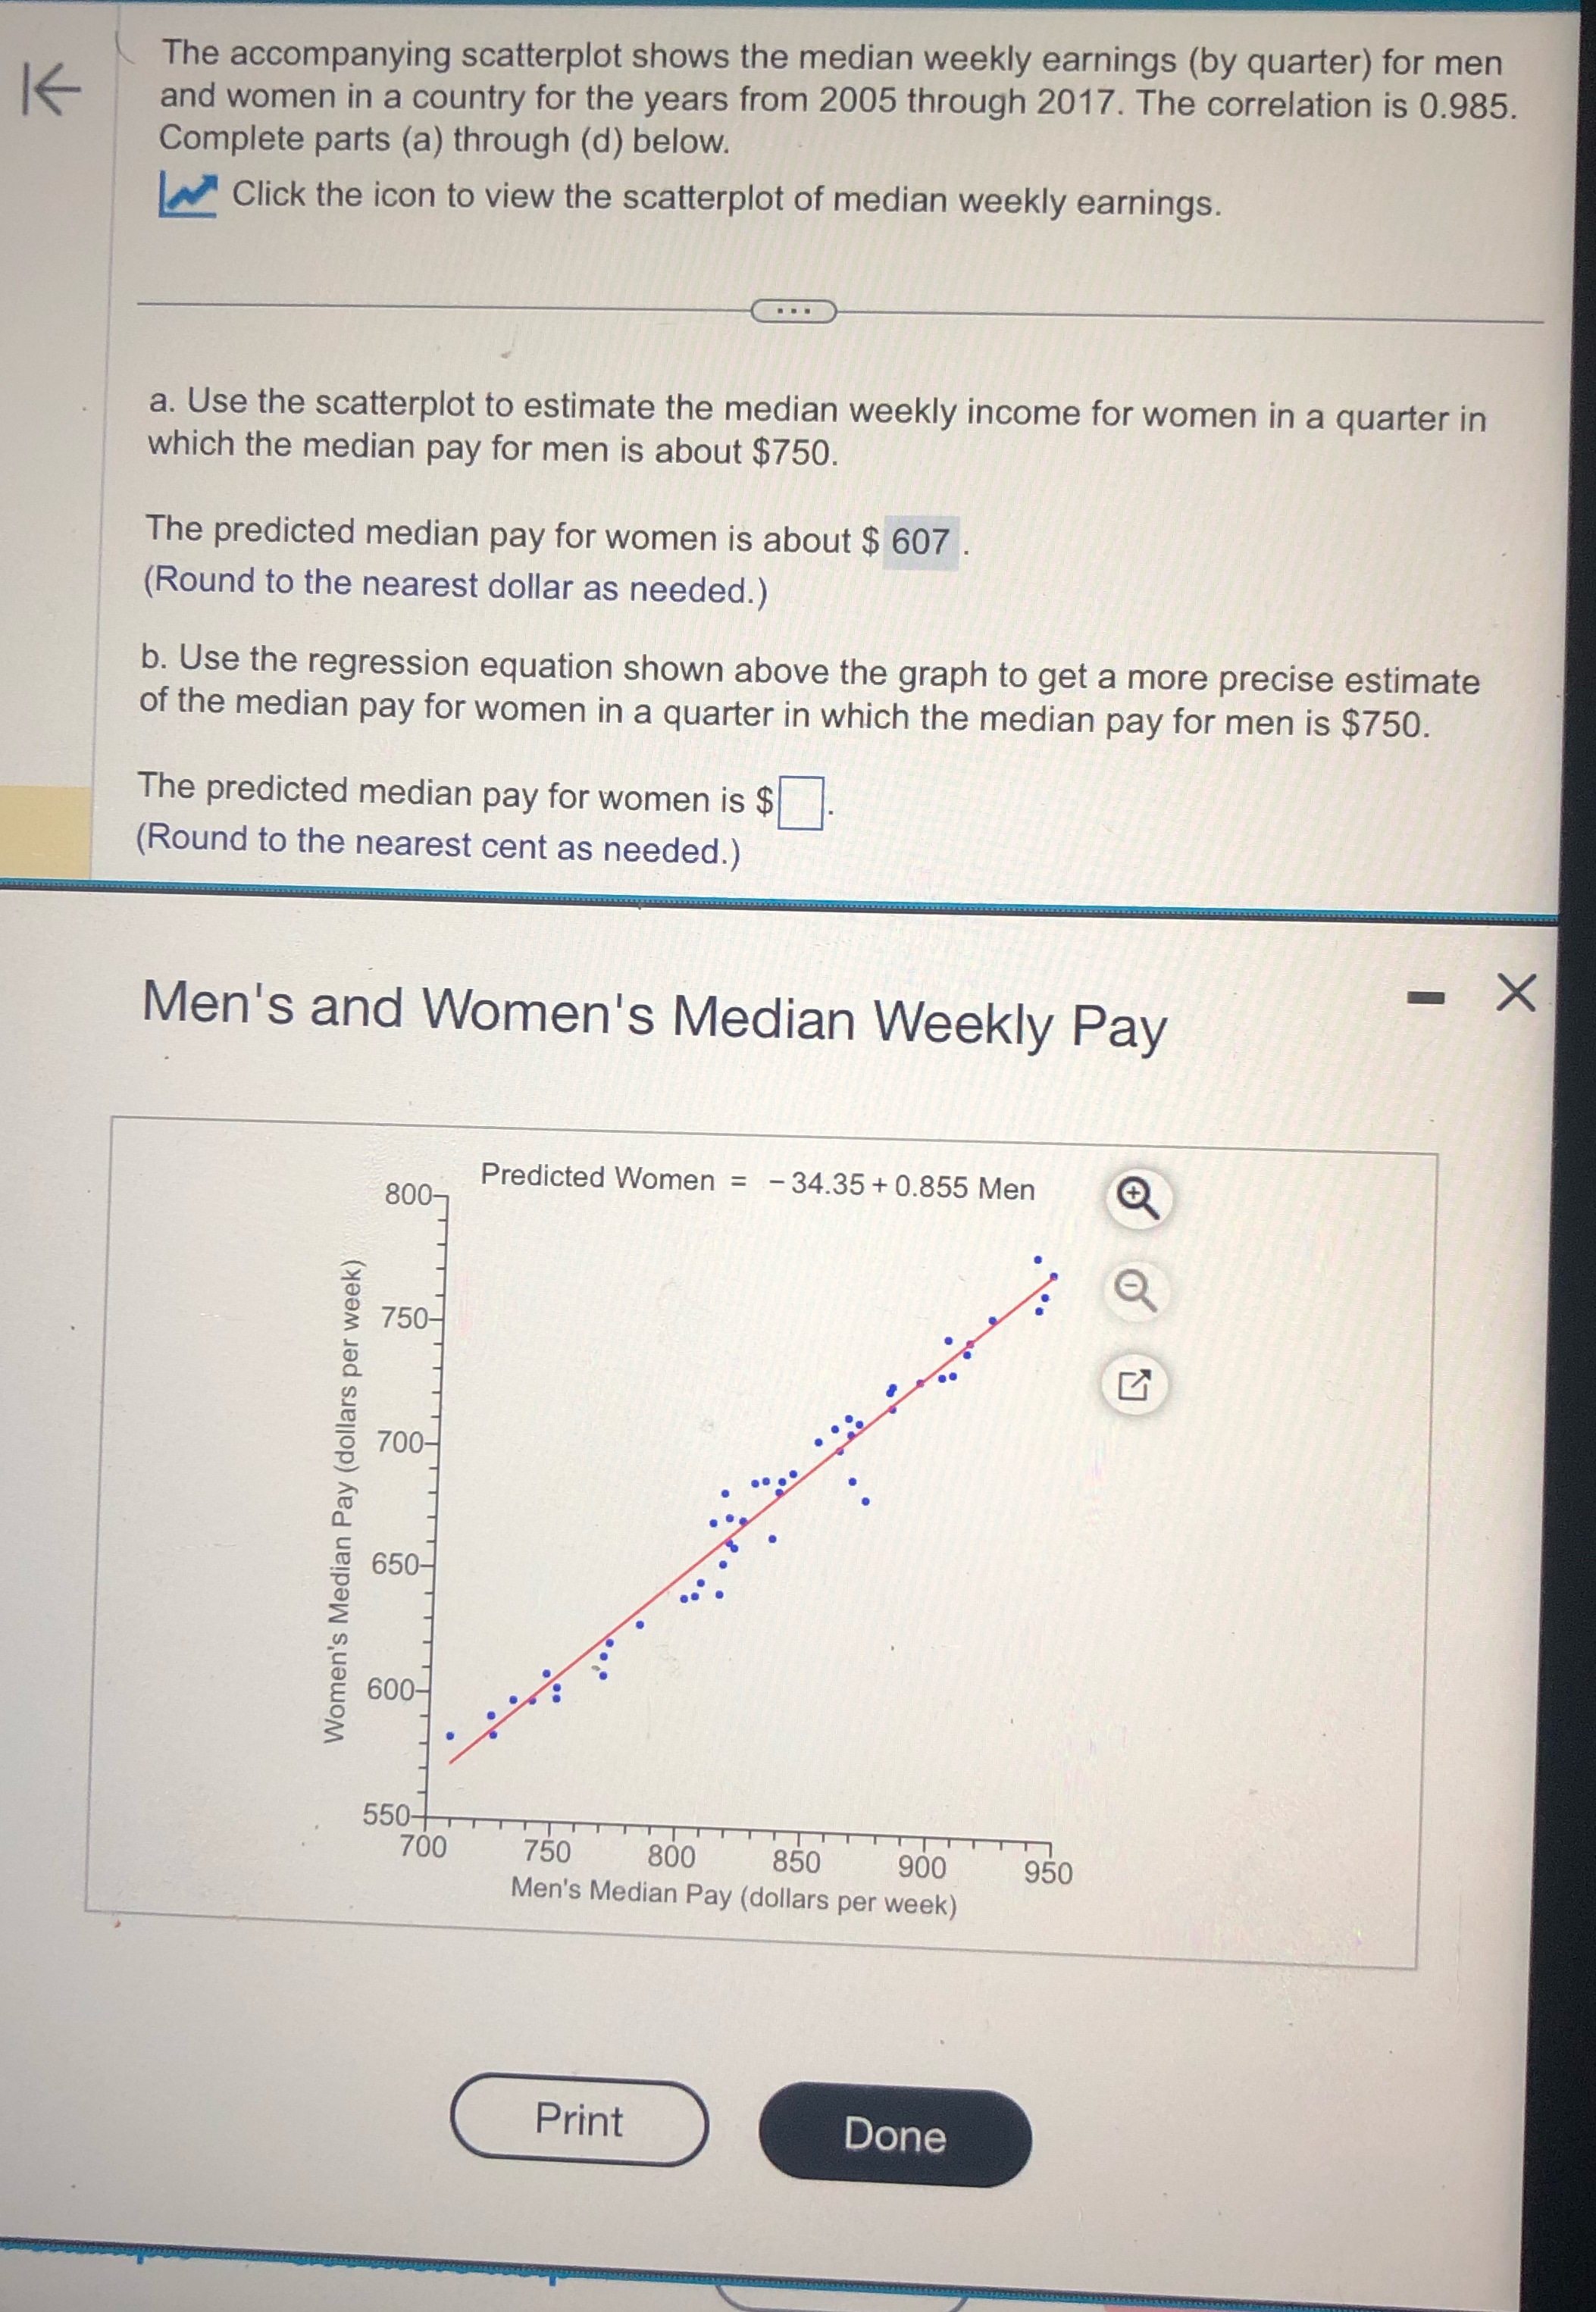
K The accompanying scatterplot shows the median weekly earnings (by quarter) for men '6 ' and women in a country for the years from 2005 through 2017. The correlation is 0.985. Complete parts (a) through (d) below. K Click the icon to view the scatterplot of median weekly earnings. @ a. Use the scatterplot to estimate the median weekly income for women in a quarter in which the median pay for men is about $750. The predicted median pay for women is about $ 607 . (Round to the nearest dollar as needed.) b. Use the regression equation shown above the graph to get a more precise estimate of the median pay for women in a quarter in which the median pay for men is $750. The predicted median pay for women is 313D. (Round to the nearest cent as needed.) Men's and Women's Median Weekly Pay 800 Predicted Women = 34.35 + 0.855 Men Q 750 700 650 600 Women's Median Pay (dollars per week) 01 01 O 700 750 800 850 900 950 Men's Median Pay (dollars per week)
Step by Step Solution
There are 3 Steps involved in it

Get step-by-step solutions from verified subject matter experts