

Question: What's the answer for question C The accompanying scatterplot shows the median weekly earnings (by quarter) for men and women in a country for the
What's the answer for question C
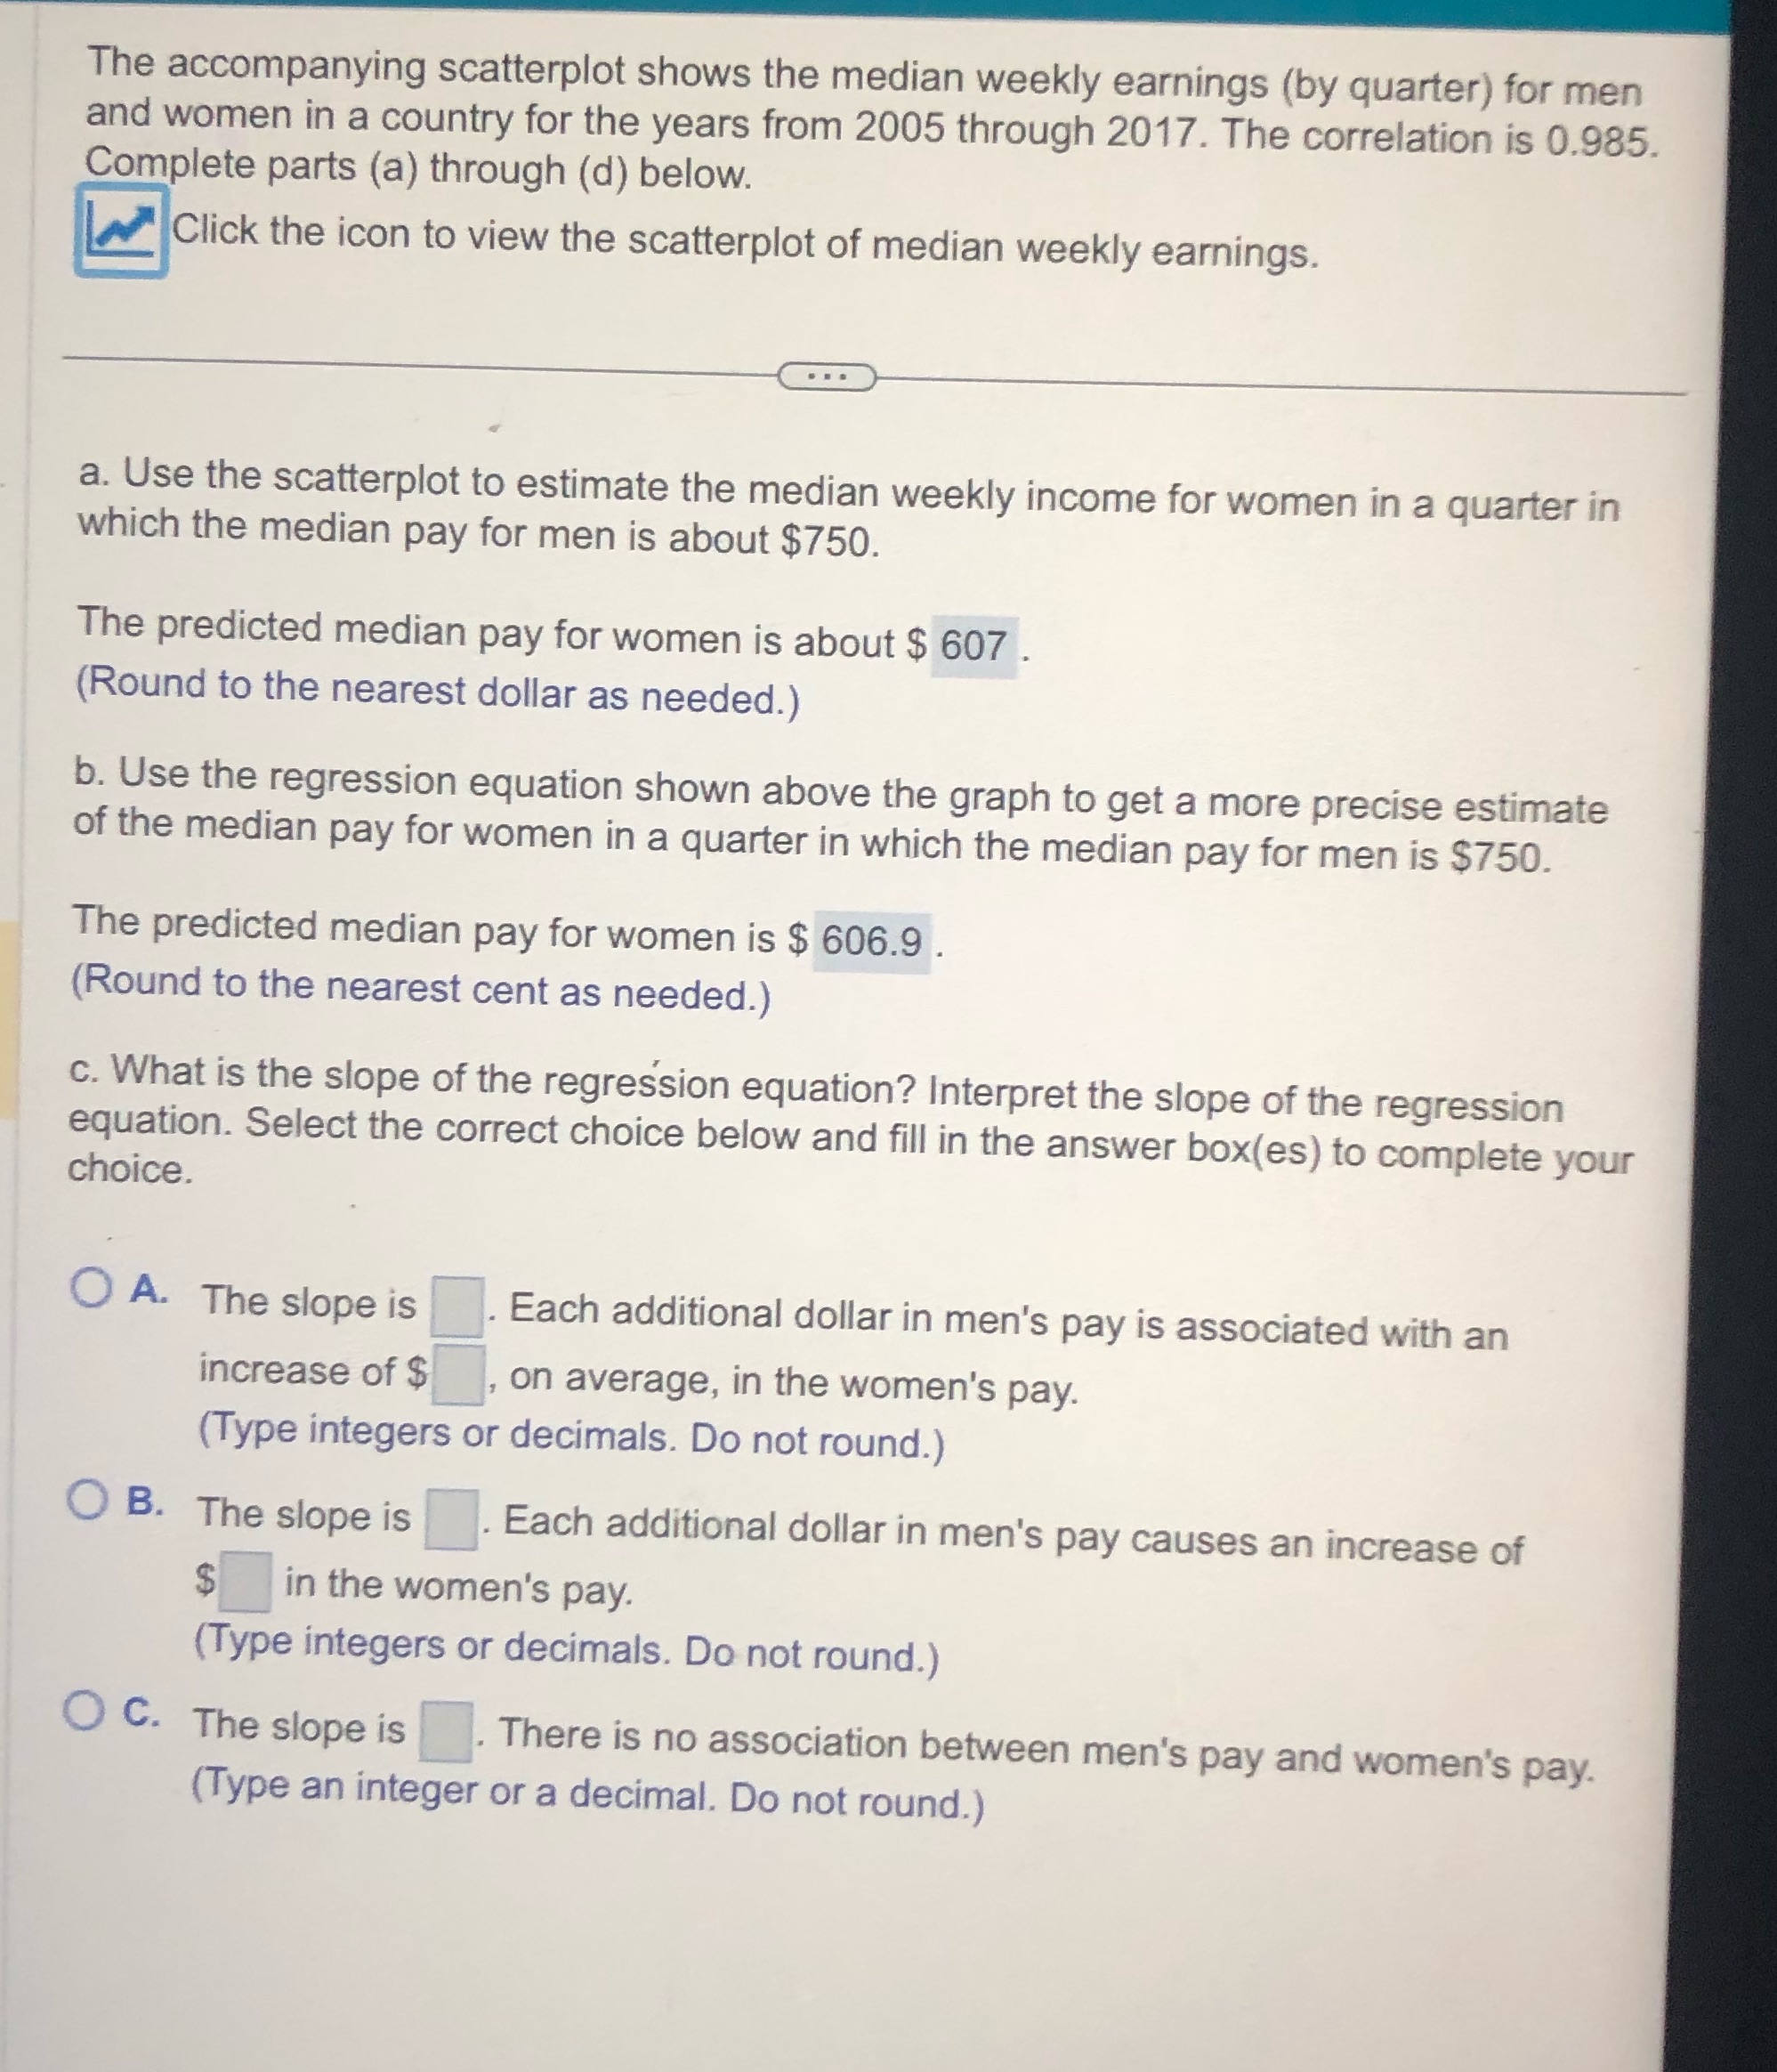
The accompanying scatterplot shows the median weekly earnings (by quarter) for men and women in a country for the years from 2005 through 2017. The correlation is 0.985. Complete parts (a) through (d) below. 'Click the icon to View the scatterplot of median weekly earnings. *ED ~ 3. Use the scatterplot to estimate the median weekly income for women in a quarter in which the median pay for men is about $750. The predicted median pay for women is about $ 607 . (Round to the nearest dollar as needed.) b. Use the regression equation shown above the graph to get a more precise estimate of the median pay for women in a quarter in which the median pay for men is 5750. The predicted median pay for women is $ 606.9 . (Round to the nearest cent as needed.) C, . F A- The slope is it . Each additional dollar in men's pay is associated with an increase of $ , on average, in the women's pay. (Type integers or decimals, Do not round.) 0 B- The slope is , . Each additional dollar in men's pay causes an increase of 5; in the women's pay. (Type integers or decimals. Do not round.) 0 C- The slope is . There is no association between men's pay and women's pay
Step by Step Solution
There are 3 Steps involved in it

Get step-by-step solutions from verified subject matter experts