

Question: What's the answer for question b K The accompanying table shows the number of wins and the number of strike-outs (SO) for 40 baseball pitchers
What's the answer for question b
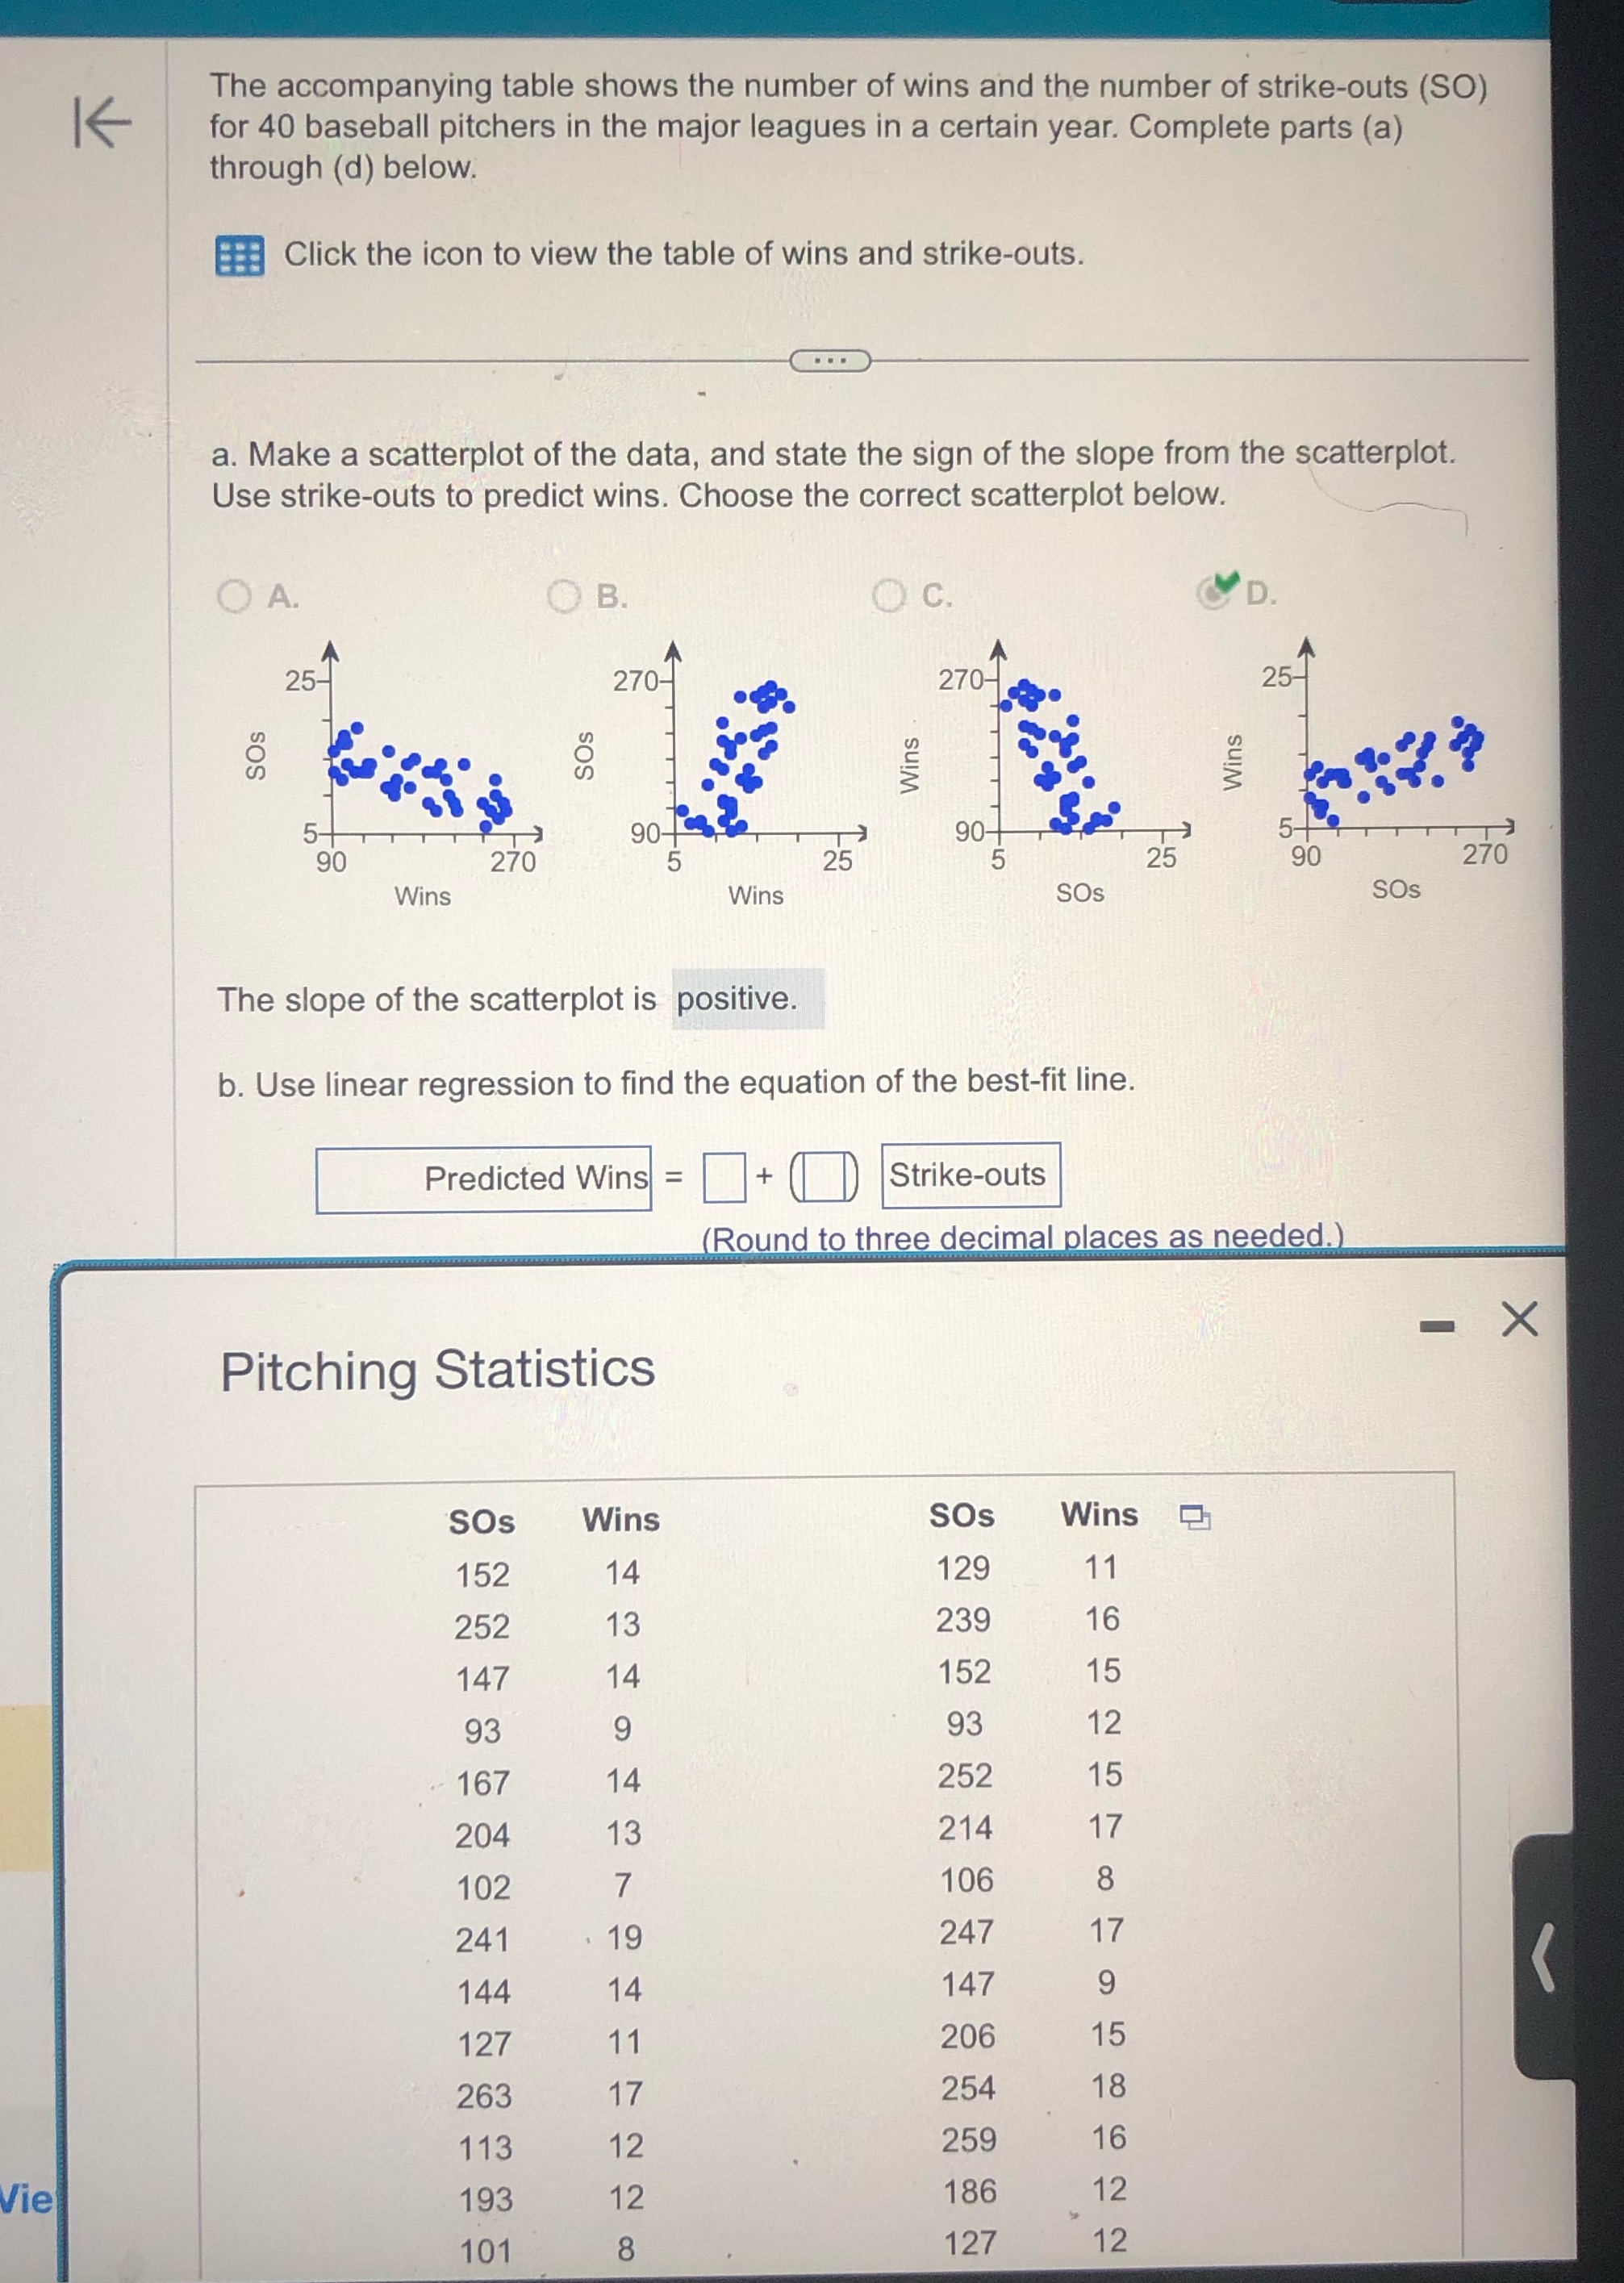
K The accompanying table shows the number of wins and the number of strike-outs (SO) for 40 baseball pitchers in the major leagues in a certain year. Complete parts (a) through (d) below. Click the icon to view the table of wins and strike-outs. a. Make a scatterplot of the data, and state the sign of the slope from the scatterplot. Use strike-outs to predict wins. Choose the correct scatterplot below. O A. O B. O c. D 25- 270- 270- 25- Os SO Wins Wins 5- 90- 90 90 270 5 25 15 25 90 270 Wins Wins SOs SOs The slope of the scatterplot is positive. b. Use linear regression to find the equation of the best-fit line. Predicted Wins = + Strike-outs Round to three decimal places as needed.) X Pitching Statistics SOs Wins SOs Wins 152 14 129 11 252 13 239 16 147 14 152 15 93 9 93 12 167 14 252 15 204 13 214 17 102 7 106 8 241 19 247 17 144 14 147 9 127 11 206 15 263 17 254 18 113 12 259 16 Vie 193 12 186 12 101 8 127 12
Step by Step Solution
There are 3 Steps involved in it

Get step-by-step solutions from verified subject matter experts