

Question: What's the answer to the question Pick the graph that goes with each numerical value listed below for the correlation V 700 + 0.29 -
What's the answer to the question
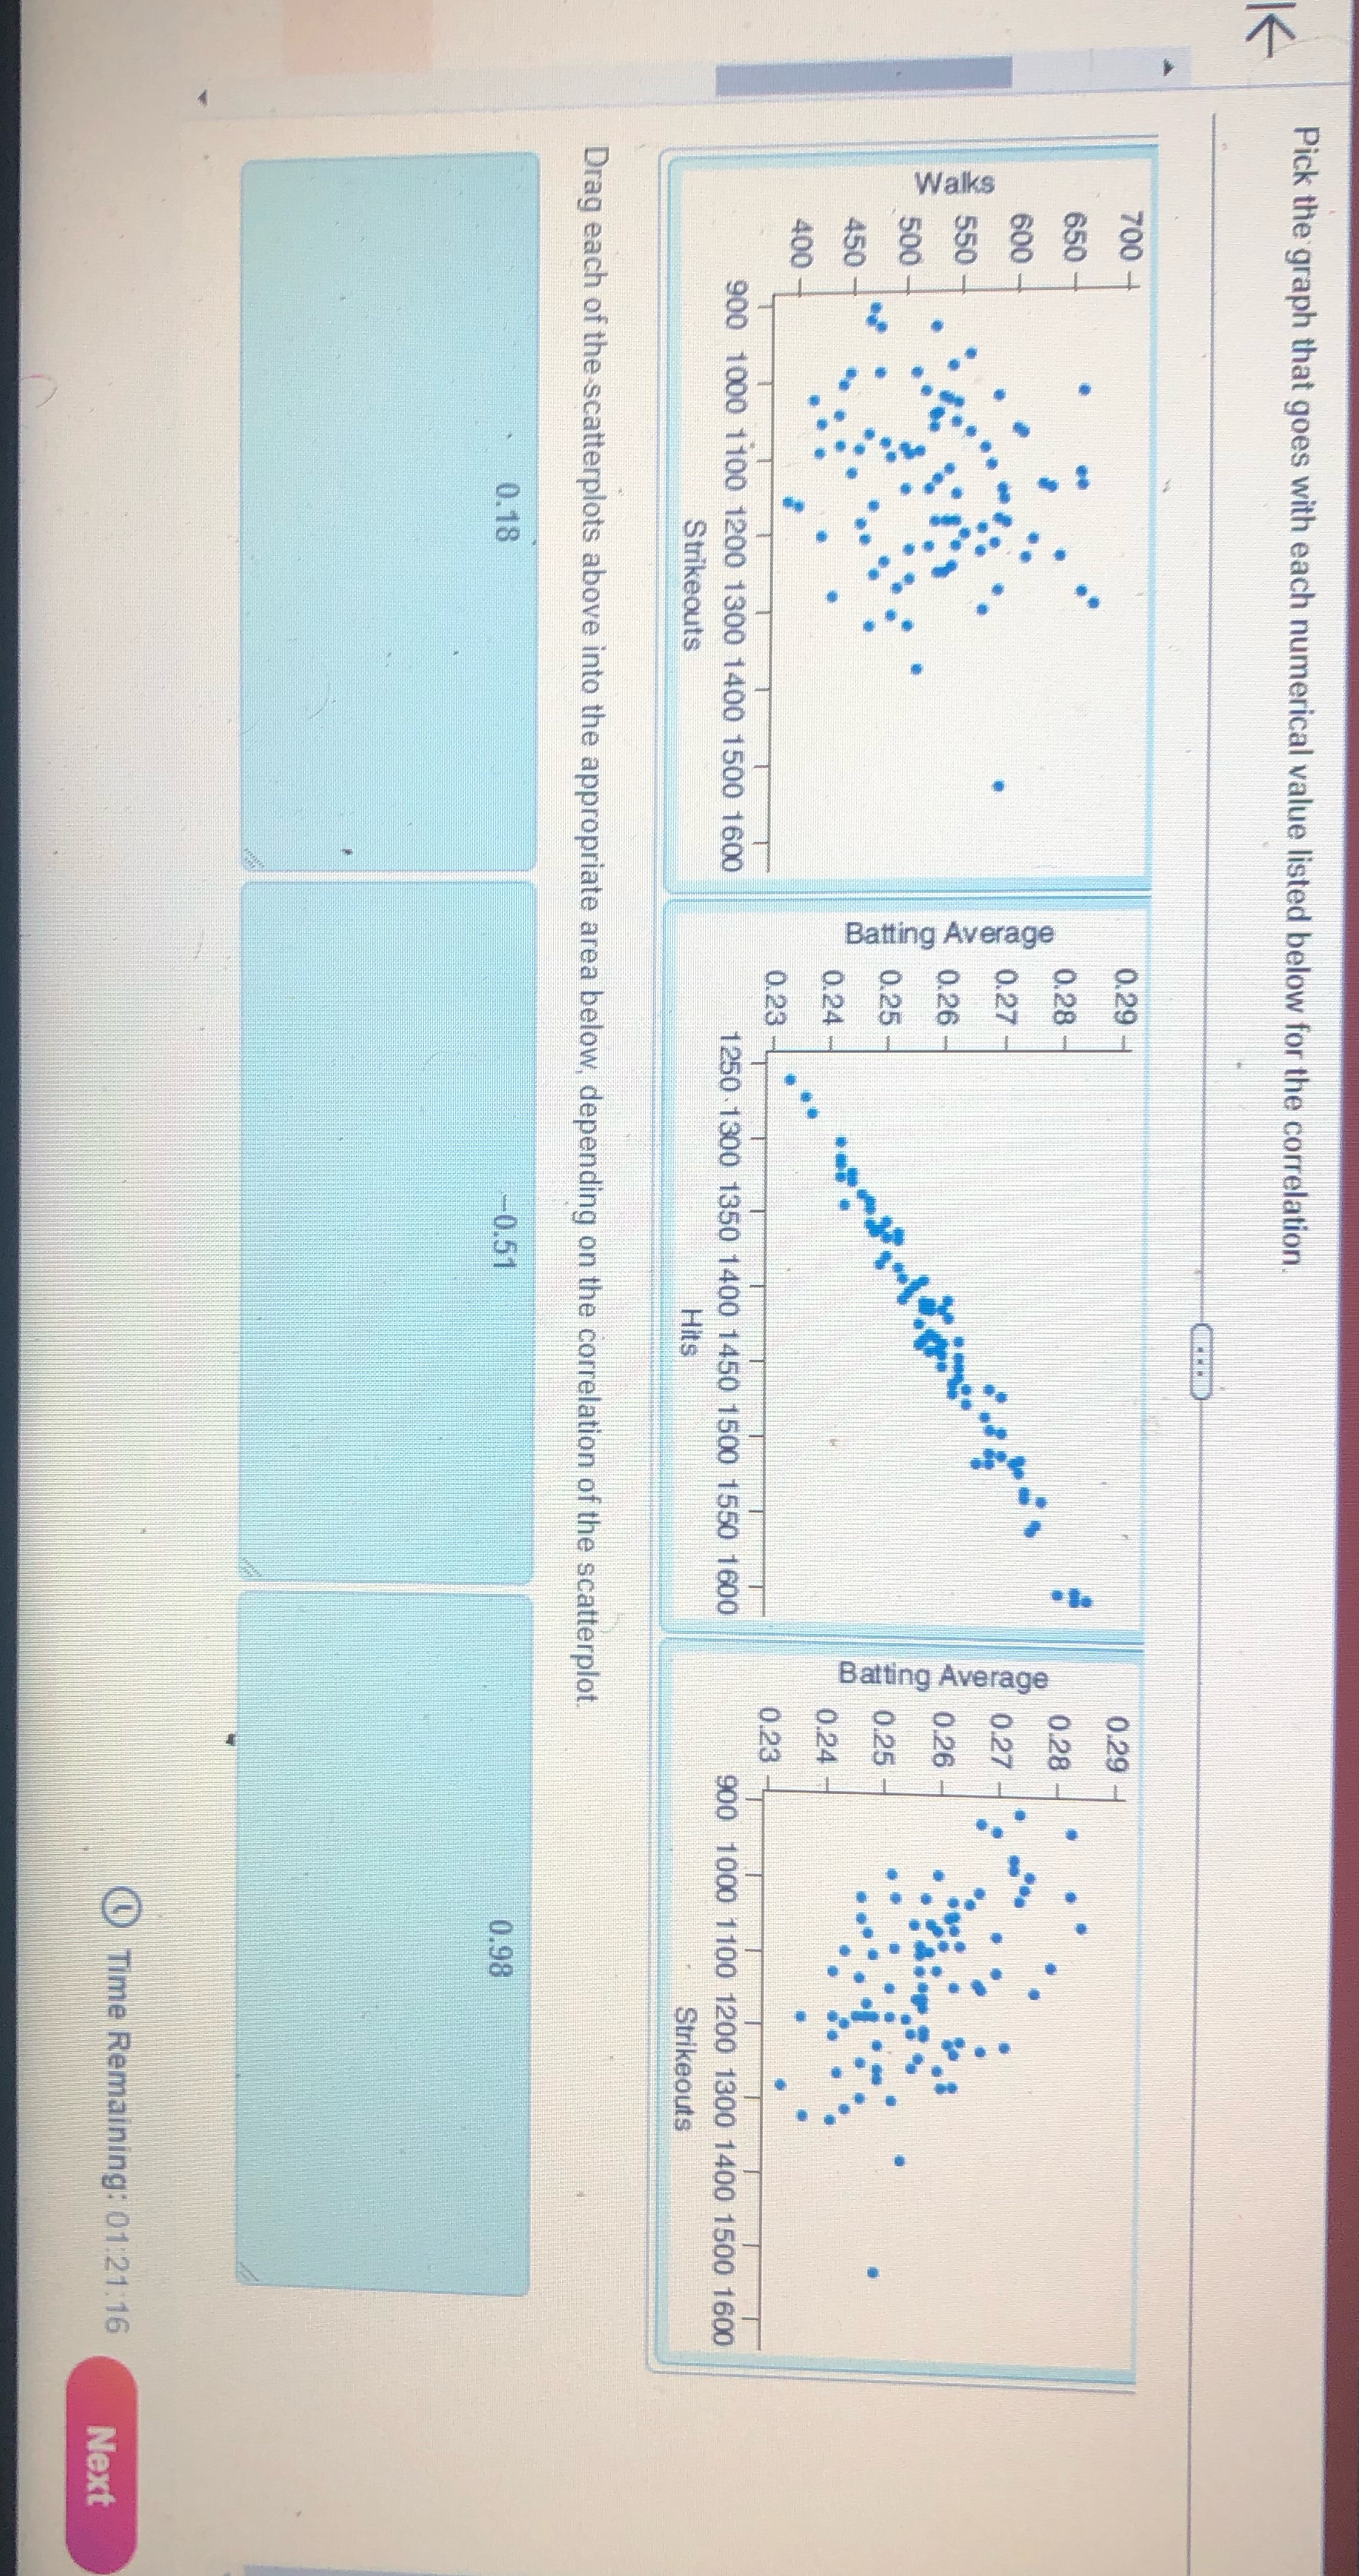
Pick the graph that goes with each numerical value listed below for the correlation V 700 + 0.29 - 0.29 650 0.28 0.28 600 - 0.27 0.27 550 - Walks Batting Average 0.26 Batting Average 0.26 500 0.25 0.25 450 0.24 - 0.24 400 0.23 - 0.23 900 1000 1 100 1200 1300 1400 1500 1600 1250 . 1300 1350 1400 1450 1500 1550 1600 900 1000 1100 1200 1300 1400 1500 1600 Strikeouts Hits Strikeouts Drag each of the scatterplots above into the appropriate area below, depending on the correlation of the scatterplot. 0.18 -0.51 0.98 Time Remaining: 01:21:16 Next
Step by Step Solution
There are 3 Steps involved in it
1 Expert Approved Answer
Step: 1 Unlock

Question Has Been Solved by an Expert!
Get step-by-step solutions from verified subject matter experts
Step: 2 Unlock
Step: 3 Unlock