

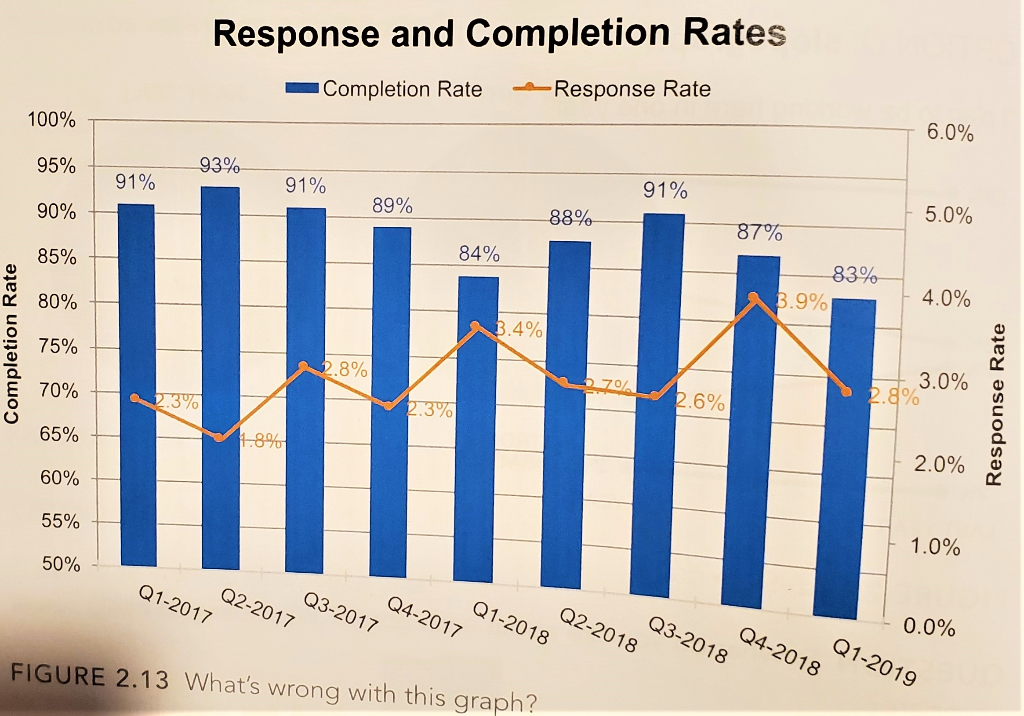
Question: What's wrong with this graph ? Using the visualization principles and concepts, list down the problems with this graph and mention how you will plot
What's wrong with this graph ? Using the visualization principles and concepts, list down the problems with this graph and mention how you will plot it differently.
Step by Step Solution
There are 3 Steps involved in it
1 Expert Approved Answer
Step: 1 Unlock

Question Has Been Solved by an Expert!
Get step-by-step solutions from verified subject matter experts
Step: 2 Unlock
Step: 3 Unlock