Question: When buying a new car, consumers need to be informed of various factors about the car. In other words, the value of a car is
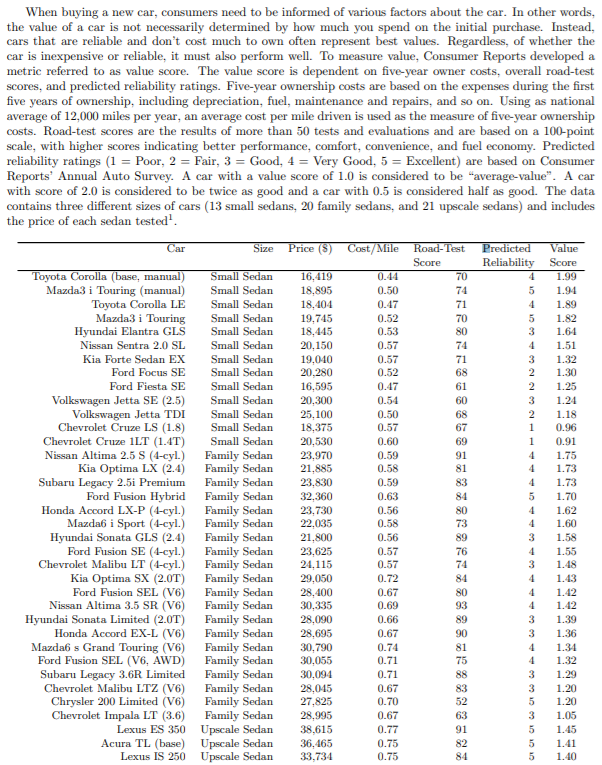
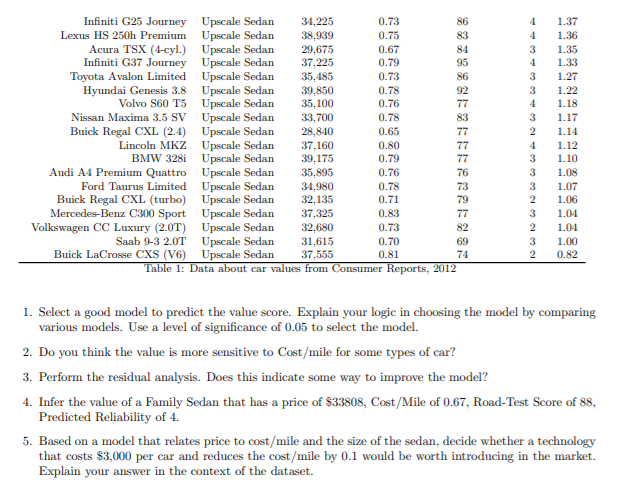
When buying a new car, consumers need to be informed of various factors about the car. In other words, the value of a car is not necessarily determined by how much you spend on the initial purchase. Instead, cars that are reliable and don't cost much to own often represent best values. Regardless of whether the car is inexpensive or reliable, it must also perform well. To measure value, Consumer Reports developed a metrie referred to as value score. The value score is dependent on five-year owner costs, overall road-test scores, and predicted reliability ratings. Five-year ownership costs are based on the expenses during the first five years of ownership, including depreciation, fuel, maintenance and repairs, and so on. Using as national average of 12,000 miles per year, an average cost per mile driven is used as the measure of five-year ownership costs. Road-test scores are the results of more than 50 tests and evaluations and are based on a 100-point scale, with higher scores indicating better performance, comfort, convenience, and fuel economy. Predicted reliability ratings (1 = Poor, 2 = Fair, 3 = Good, 4 = Very Good, 5 = Excellent) are based on Consumer Reports' Annual Auto Survey. A car with a value score of 1.0 is considered to be "average_value". A car with score of 2.0 is considered to be twice as good and a car with 0.5 is considered half as good. The data contains three different sizes of cars (13 small sedans, 20 family sedans, and 21 upscale sedans) and includes the price of each sedan tested. Car Size Price ($) Cost/Mile Toyota Corolla (base, manual) Small Sedan Mazda3 i Touring (manual) Small Sedan Toyota Corolla LE Small Sedan Mazda3 i Touring Small Sedan Hyundai Elantra GLS Small Sedan Nissan Sentra 2.0 SL Small Sedan Kia Forte Sedan EX Small Sedan Ford Focus SE Small Sedan Ford Fiesta SE Small Sedan Volkswagen Jetta SE (2.5) Small Sedan Volkswagen Jetta TDI Small Sedan Chevrolet Cruze LS (1.8) Small Sedan Chevrolet Cruze LT (1.4T) Small Sedan Nissan Altima 2.5 S (4-cyl.) Family Sedan Kia Optima LX (2.4) Family Sedan Subaru Legacy 2.5i Premium Family Sedan Ford Fusion Hybrid Family Sedan Honda Accord LX-P (4-cyl.) Family Sedan Mazda6 i Sport (4-cyl.) Family Sedan Hyundai Sonata GLS (2.4) Family Sedan Ford Fusion SE (4-cyl.) Family Sedan Chevrolet Malibu LT (4-cyl.) Family Sedan Kia Optima SX 2.0T) Family Sedan Ford Fusion SEL (76) Family Sedan Nissan Altima 3.5 SR (V6) Family Sedan Hyundai Sonata Limited (2.0T) Family Sedan Honda Accord EX-L (V6) Family Sedan Mazda6 s Grand Touring (16) Family Sedan Ford Fusion SEL (V6, AWD) Family Sedan Subaru Legacy 3.6R Limited Family Sedan Chevrolet Malibu LTZ (V6) Family Sedan Chrysler 200 Limited (16) Family Sedan Chevrolet Impala LT (3.6) Family Sedan Lexus ES 350 Upscale Sedan Acura TL (base) Upscale Sedan Lexus IS 250 Upscale Sedan 16.419 18,895 18.404 19,745 18,445 20.150 19.040 20.280 16,595 20,300 25,100 18,375 20,530 23.970 21.885 23,830 32,360 23.730 22.035 21.800 23,625 24.115 29.050 28,400 30,335 28.090 28.695 30.790 30.055 30,094 28.045 27.825 28.995 38,615 36,465 33.734 0.44 0.50 0.47 0.52 0.53 0.57 0.57 0.52 0.47 0.54 0.50 0.57 0.60 0.59 0.58 0.59 0.63 0.56 0.58 0.56 0.57 0.57 0.72 0.67 0.69 0.66 0.67 0.74 0.71 0.71 0.67 0.70 0.67 0.77 0.75 0.75 Road-Test Score 70 74 71 70 80 74 71 68 61 60 68 67 69 91 81 83 84 80 73 89 76 74 84 80 93 89 90 81 75 Predicted Value Reliability Score 1.99 5 1.94 4 1.89 5 1.82 3 1.64 1.51 3 1.32 2 1.30 2 1.25 3 1.24 2 1.18 1 0.96 1 0.91 1.75 1.73 4 1.73 5 1.70 4 1.62 4 1.60 3 1.58 1.55 3 1.48 4 1.43 1.42 4 1.42 3 1.39 3 1.36 4 1.34 4 1.32 3 1.29 3 1.20 5 1.20 3 1.05 5 1.45 5 1.41 5 1.40 83 52 63 91 82 84 Infiniti G25 Journey Upscale Sedan 34.225 0.73 86 Lexus HS 250h Premium Upscale Sedan 38,939 0.75 83 Acura TSX (4-cyl.) Upscale Sedan 29,675 0.67 84 Infiniti G37 Journey Upscale Sedan 37.225 0.79 95 Toyota Avalon Limited Upscale Sedan 35,485 0.73 86 Hyundai Genesis 3.8 Upscale Sedan 39.850 0.78 92 Volvo S60 T5 Upscale Sedan 35,100 0.76 Nissan Maxima 3.5 SV Upscale Sedan 33,700 0.78 Buick Regal CXL (2.4) Upscale Sedan 28,840 0.65 Lincoln MKZ Upscale Sedan 37.160 0.80 77 BMW 328i Upscale Sedan 39,175 0.79 77 Audi A4 Premium Quattro Upscale Sedan 35,895 0.76 76 Ford Taurus Limited Upscale Sedan 34.980 0.78 73 Buick Regal CXL (turbo) Upscale Sedan 32.135 0.71 79 Mercedes-Benz C300 Sport Upscale Sedan 37,325 0.83 77 Volkswagen CC Luxury (2.0T) Upscale Sedan 32.680 0.73 82 Saab 9-3 2.0T Upscale Sedan 31.615 0.70 69 Buick LaCrosse CXS (76) Upscale Sedan 37.555 0.81 74 Table 1: Data about car values from Consumer Reports, 2012 4 4 3 4 3 3 4 3 2 4 3 3 3 2 3 2 3 2 1.37 1.36 1.35 1.33 1.27 1.22 1.18 1.17 1.14 1.12 1.10 1.08 1.07 1.06 1.04 1.04 1.00 0.82 3 1. Select a good model to predict the value score. Explain your logic in choosing the model by comparing various models. Use a level of significance of 0.05 to select the model. 2. Do you think the value is more sensitive to Cost/mile for some types of car? 3. Perform the residual analysis. Does this indicate some way to improve the model? 4. Infer the value of a Family Sedan that has a price of $33808, Cost/Mile of 0.67, Road-Test Score of 88, Predicted Reliability of 4. 5. Based on a model that relates price to cost/mile and the size of the sedan, decide whether a technology that costs $3,000 per car and reduces the cost/mile by 0.1 would be worth introducing in the market. Explain your answer in the context of the dataset. When buying a new car, consumers need to be informed of various factors about the car. In other words, the value of a car is not necessarily determined by how much you spend on the initial purchase. Instead, cars that are reliable and don't cost much to own often represent best values. Regardless of whether the car is inexpensive or reliable, it must also perform well. To measure value, Consumer Reports developed a metrie referred to as value score. The value score is dependent on five-year owner costs, overall road-test scores, and predicted reliability ratings. Five-year ownership costs are based on the expenses during the first five years of ownership, including depreciation, fuel, maintenance and repairs, and so on. Using as national average of 12,000 miles per year, an average cost per mile driven is used as the measure of five-year ownership costs. Road-test scores are the results of more than 50 tests and evaluations and are based on a 100-point scale, with higher scores indicating better performance, comfort, convenience, and fuel economy. Predicted reliability ratings (1 = Poor, 2 = Fair, 3 = Good, 4 = Very Good, 5 = Excellent) are based on Consumer Reports' Annual Auto Survey. A car with a value score of 1.0 is considered to be "average_value". A car with score of 2.0 is considered to be twice as good and a car with 0.5 is considered half as good. The data contains three different sizes of cars (13 small sedans, 20 family sedans, and 21 upscale sedans) and includes the price of each sedan tested. Car Size Price ($) Cost/Mile Toyota Corolla (base, manual) Small Sedan Mazda3 i Touring (manual) Small Sedan Toyota Corolla LE Small Sedan Mazda3 i Touring Small Sedan Hyundai Elantra GLS Small Sedan Nissan Sentra 2.0 SL Small Sedan Kia Forte Sedan EX Small Sedan Ford Focus SE Small Sedan Ford Fiesta SE Small Sedan Volkswagen Jetta SE (2.5) Small Sedan Volkswagen Jetta TDI Small Sedan Chevrolet Cruze LS (1.8) Small Sedan Chevrolet Cruze LT (1.4T) Small Sedan Nissan Altima 2.5 S (4-cyl.) Family Sedan Kia Optima LX (2.4) Family Sedan Subaru Legacy 2.5i Premium Family Sedan Ford Fusion Hybrid Family Sedan Honda Accord LX-P (4-cyl.) Family Sedan Mazda6 i Sport (4-cyl.) Family Sedan Hyundai Sonata GLS (2.4) Family Sedan Ford Fusion SE (4-cyl.) Family Sedan Chevrolet Malibu LT (4-cyl.) Family Sedan Kia Optima SX 2.0T) Family Sedan Ford Fusion SEL (76) Family Sedan Nissan Altima 3.5 SR (V6) Family Sedan Hyundai Sonata Limited (2.0T) Family Sedan Honda Accord EX-L (V6) Family Sedan Mazda6 s Grand Touring (16) Family Sedan Ford Fusion SEL (V6, AWD) Family Sedan Subaru Legacy 3.6R Limited Family Sedan Chevrolet Malibu LTZ (V6) Family Sedan Chrysler 200 Limited (16) Family Sedan Chevrolet Impala LT (3.6) Family Sedan Lexus ES 350 Upscale Sedan Acura TL (base) Upscale Sedan Lexus IS 250 Upscale Sedan 16.419 18,895 18.404 19,745 18,445 20.150 19.040 20.280 16,595 20,300 25,100 18,375 20,530 23.970 21.885 23,830 32,360 23.730 22.035 21.800 23,625 24.115 29.050 28,400 30,335 28.090 28.695 30.790 30.055 30,094 28.045 27.825 28.995 38,615 36,465 33.734 0.44 0.50 0.47 0.52 0.53 0.57 0.57 0.52 0.47 0.54 0.50 0.57 0.60 0.59 0.58 0.59 0.63 0.56 0.58 0.56 0.57 0.57 0.72 0.67 0.69 0.66 0.67 0.74 0.71 0.71 0.67 0.70 0.67 0.77 0.75 0.75 Road-Test Score 70 74 71 70 80 74 71 68 61 60 68 67 69 91 81 83 84 80 73 89 76 74 84 80 93 89 90 81 75 Predicted Value Reliability Score 1.99 5 1.94 4 1.89 5 1.82 3 1.64 1.51 3 1.32 2 1.30 2 1.25 3 1.24 2 1.18 1 0.96 1 0.91 1.75 1.73 4 1.73 5 1.70 4 1.62 4 1.60 3 1.58 1.55 3 1.48 4 1.43 1.42 4 1.42 3 1.39 3 1.36 4 1.34 4 1.32 3 1.29 3 1.20 5 1.20 3 1.05 5 1.45 5 1.41 5 1.40 83 52 63 91 82 84 Infiniti G25 Journey Upscale Sedan 34.225 0.73 86 Lexus HS 250h Premium Upscale Sedan 38,939 0.75 83 Acura TSX (4-cyl.) Upscale Sedan 29,675 0.67 84 Infiniti G37 Journey Upscale Sedan 37.225 0.79 95 Toyota Avalon Limited Upscale Sedan 35,485 0.73 86 Hyundai Genesis 3.8 Upscale Sedan 39.850 0.78 92 Volvo S60 T5 Upscale Sedan 35,100 0.76 Nissan Maxima 3.5 SV Upscale Sedan 33,700 0.78 Buick Regal CXL (2.4) Upscale Sedan 28,840 0.65 Lincoln MKZ Upscale Sedan 37.160 0.80 77 BMW 328i Upscale Sedan 39,175 0.79 77 Audi A4 Premium Quattro Upscale Sedan 35,895 0.76 76 Ford Taurus Limited Upscale Sedan 34.980 0.78 73 Buick Regal CXL (turbo) Upscale Sedan 32.135 0.71 79 Mercedes-Benz C300 Sport Upscale Sedan 37,325 0.83 77 Volkswagen CC Luxury (2.0T) Upscale Sedan 32.680 0.73 82 Saab 9-3 2.0T Upscale Sedan 31.615 0.70 69 Buick LaCrosse CXS (76) Upscale Sedan 37.555 0.81 74 Table 1: Data about car values from Consumer Reports, 2012 4 4 3 4 3 3 4 3 2 4 3 3 3 2 3 2 3 2 1.37 1.36 1.35 1.33 1.27 1.22 1.18 1.17 1.14 1.12 1.10 1.08 1.07 1.06 1.04 1.04 1.00 0.82 3 1. Select a good model to predict the value score. Explain your logic in choosing the model by comparing various models. Use a level of significance of 0.05 to select the model. 2. Do you think the value is more sensitive to Cost/mile for some types of car? 3. Perform the residual analysis. Does this indicate some way to improve the model? 4. Infer the value of a Family Sedan that has a price of $33808, Cost/Mile of 0.67, Road-Test Score of 88, Predicted Reliability of 4. 5. Based on a model that relates price to cost/mile and the size of the sedan, decide whether a technology that costs $3,000 per car and reduces the cost/mile by 0.1 would be worth introducing in the market. Explain your answer in the context of the dataset


