

Question: Underground Sandwiches, a sandwich shop, has the following marginal physical product curve (labeled MPP) for its hourly production. (?) 20 18 16 O MPP
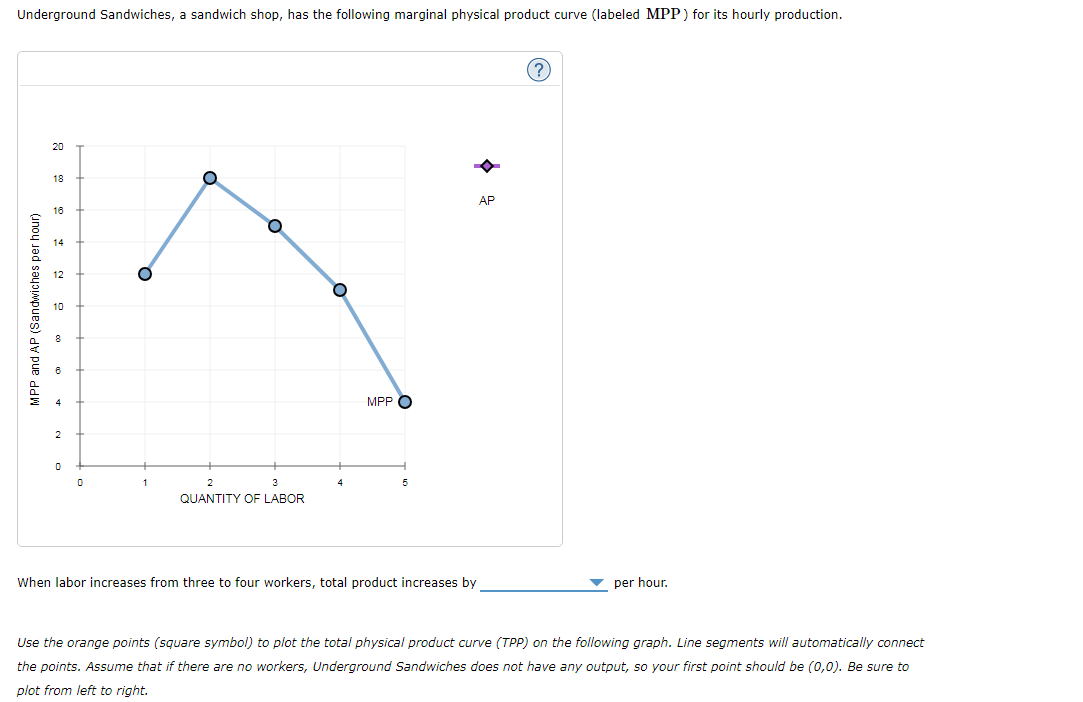
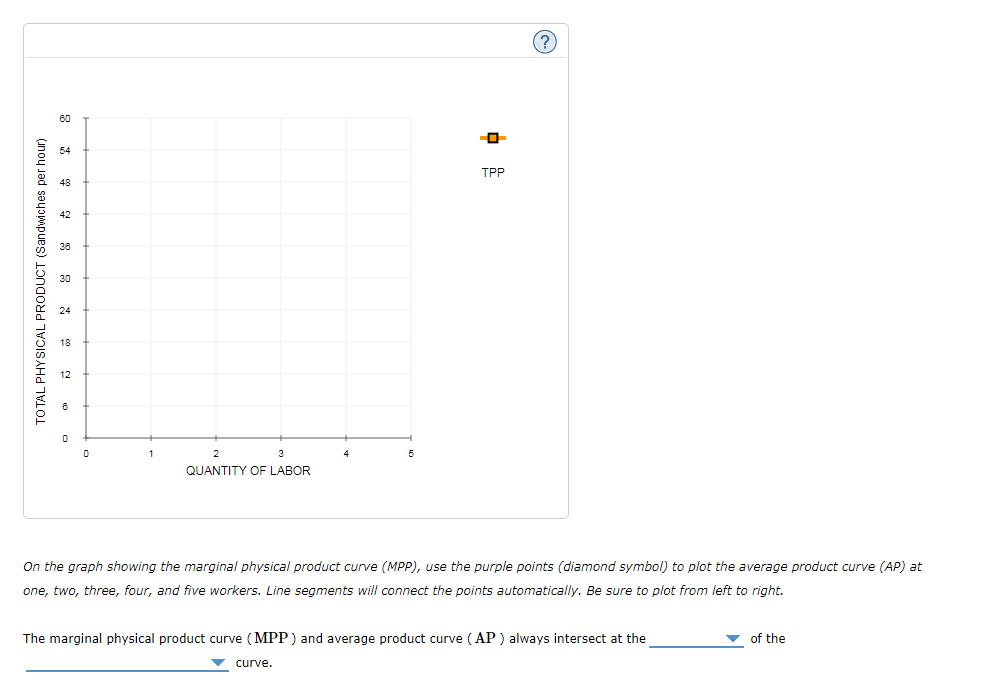
Underground Sandwiches, a sandwich shop, has the following marginal physical product curve (labeled MPP) for its hourly production. (?) 20 18 16 O MPP and AP (Sandwiches per hour) AP MPP 0 1 3 5 QUANTITY OF LABOR When labor increases from three to four workers, total product increases by per hour. Use the orange points (square symbol) to plot the total physical product curve (TPP) on the following graph. Line segments will automatically connect the points. Assume that if there are no workers, Underground Sandwiches does not have any output, so your first point should be (0,0). Be sure to plot from left to right. TOTAL PHYSICAL PRODUCT (Sandwiches per hour) 60 48 42 38 30 18 12 TPP ? 3 5 QUANTITY OF LABOR On the graph showing the marginal physical product curve (MPP), use the purple points (diamond symbol) to plot the average product curve (AP) at one, two, three, four, and five workers. Line segments will connect the points automatically. Be sure to plot from left to right. The marginal physical product curve (MPP) and average product curve (AP) always intersect at the of the curve.
Step by Step Solution
3.45 Rating (168 Votes )
There are 3 Steps involved in it
1 MPP Change in TPP Change in L AP TPP L Data table used L MPP TPP AP 0 0 ... View full answer

Get step-by-step solutions from verified subject matter experts