

Question: when plotting an array of data Using MATLAB, I want the peaks to be labeld by their amplitude. How to do that? if it is
when plotting an array of data Using MATLAB, I want the peaks to be labeld by their amplitude. How to do that? if it is not possible how can I I label all the points plotted with their values? like this image there are numbers on the peak labled with numbers. However I want to lebel them with their actual values.
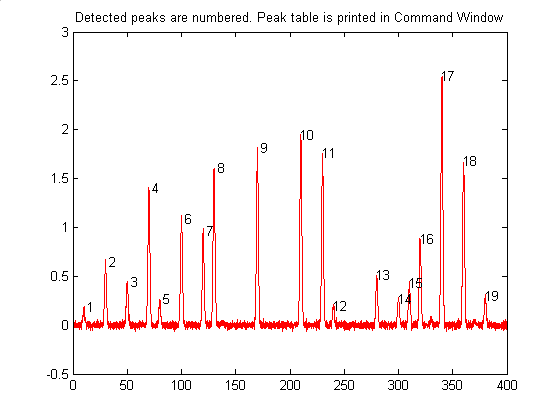
Detected peaks are numbered. Peak table is printed in Command Window 17 2.5 10 18 1.5 16 13 0.5 19 0.5 50 100 150 200 250 300 350 400
Step by Step Solution
There are 3 Steps involved in it
1 Expert Approved Answer
Step: 1 Unlock

Question Has Been Solved by an Expert!
Get step-by-step solutions from verified subject matter experts
Step: 2 Unlock
Step: 3 Unlock