

Question: When we construct R-chart and Xbar chart using Exhibit 10.13., What is type I error here? What is the underlying statistical distribution of p-chart? What
When we construct R-chart and Xbar chart using Exhibit 10.13., What is type I error here?
What is the underlying statistical distribution of p-chart?
What is the underlying statistical distribution of c-chart?
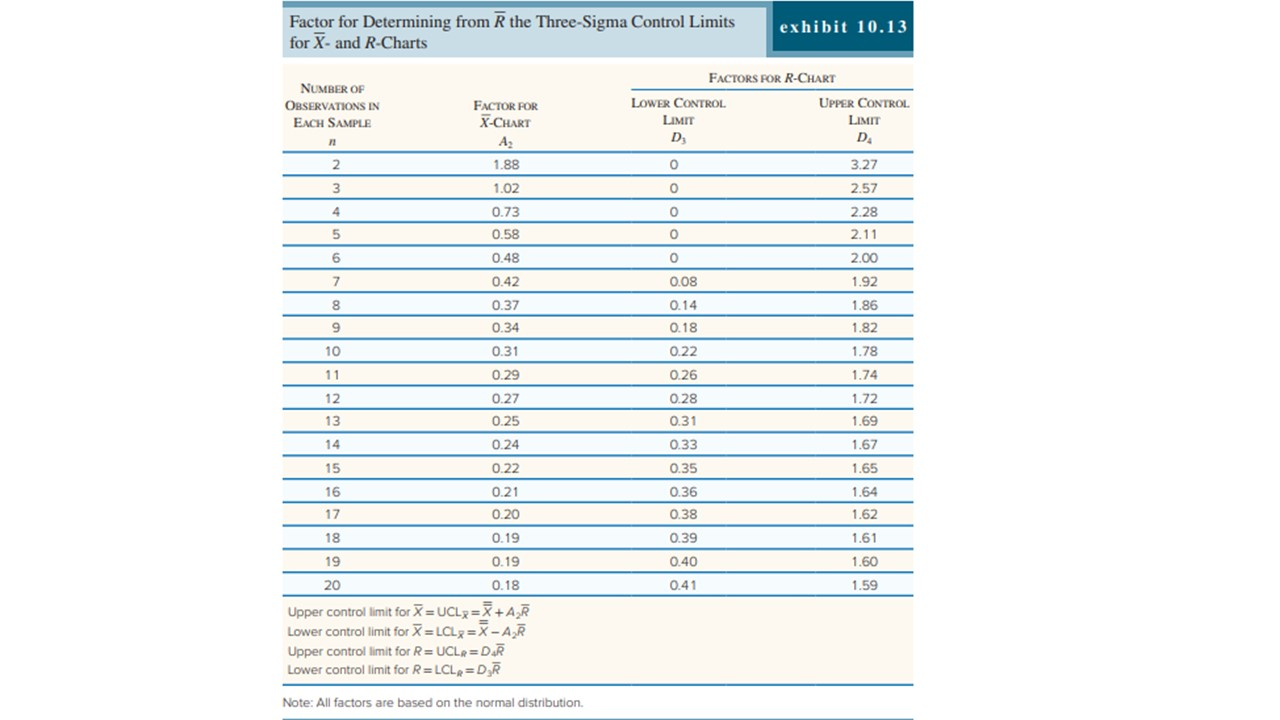
Factor for Determining from R the Three-Sigma Control Limits for X- and R-Charts exhibit 10.13 N FACTORS FOR R-CHART NUMBER OF OBSERVATIONS IN FACTOR POR LOWER CONTROL UPPER CONTROL EACH SAMPLE X-CHART LIMIT LIMIT D; D. 2 1.88 0 3 .27 31 .02 0 2 .57 0.73 0 2.28 50.58 02.11 6 0.48 0 2.00 7 0.42 0.08 1.92 0.37 0.14 1.86 0.34 0.18 1.82 0.31 0.22 1.78 11 0.29 0.26 1.74 12 0.27 0.28 1.72 13 0.25 0.31 1.69 14 0.24 0.33 1.67 022 035 1 65 16 0.21 0.36 1.64 17 0.20 0.38 1.62 18 0.19 0.39 1.61 19 0.19 0.40 1.60 20 0.18 0.41 1.59 Upper controllimit for X = UCL2=X+AR Lower controllimit for X=LCLX = X-AR Upper controllimit for R=UCLR=DR Lower controllimit for R=LCLR=DR Note: All factors are based on the normal distributionStep by Step Solution
There are 3 Steps involved in it
1 Expert Approved Answer
Step: 1 Unlock

Question Has Been Solved by an Expert!
Get step-by-step solutions from verified subject matter experts
Step: 2 Unlock
Step: 3 Unlock