

Question: When we use 'expectation theory' to calculate the average, variance, and standard deviation of future retums for different securities and different scenarios that have varying
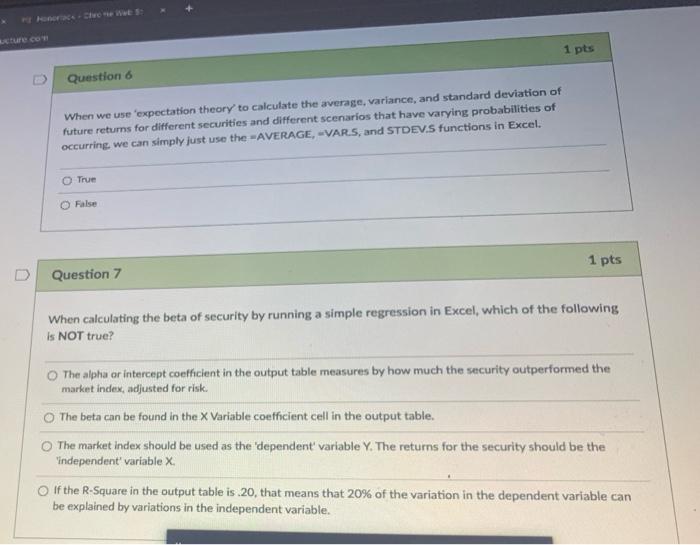
When we use 'expectation theory' to calculate the average, variance, and standard deviation of future retums for different securities and different scenarios that have varying probabilities of occurring we can simply just use the =AVERAGE, =VAR.S, and STDEV.S functions in Excel. True False Question 7 1. pts When calculating the beta of security by running a simple regression in Excel, which of the following is NOT true? The alpha or intercept coefficient in the output table measures by how much the security outperformed the market index, adjusted for risk. The beta can be found in the X Variable coefficient cell in the output table. The market index should be used as the 'dependent' variable Y. The returns for the security should be the 'independent' variable X. If the R-Square in the output table is .20, that means that 20% of the variation in the dependent variable can be explained by variations in the independent variable
Step by Step Solution
There are 3 Steps involved in it

Get step-by-step solutions from verified subject matter experts