

Question: When would a consumer want to use : ResponsiveEd Graduation Portfolio Subject: Algebra I Project Assignment Subject Algebra I Topic information: This project requires students
When would a consumer want to use :
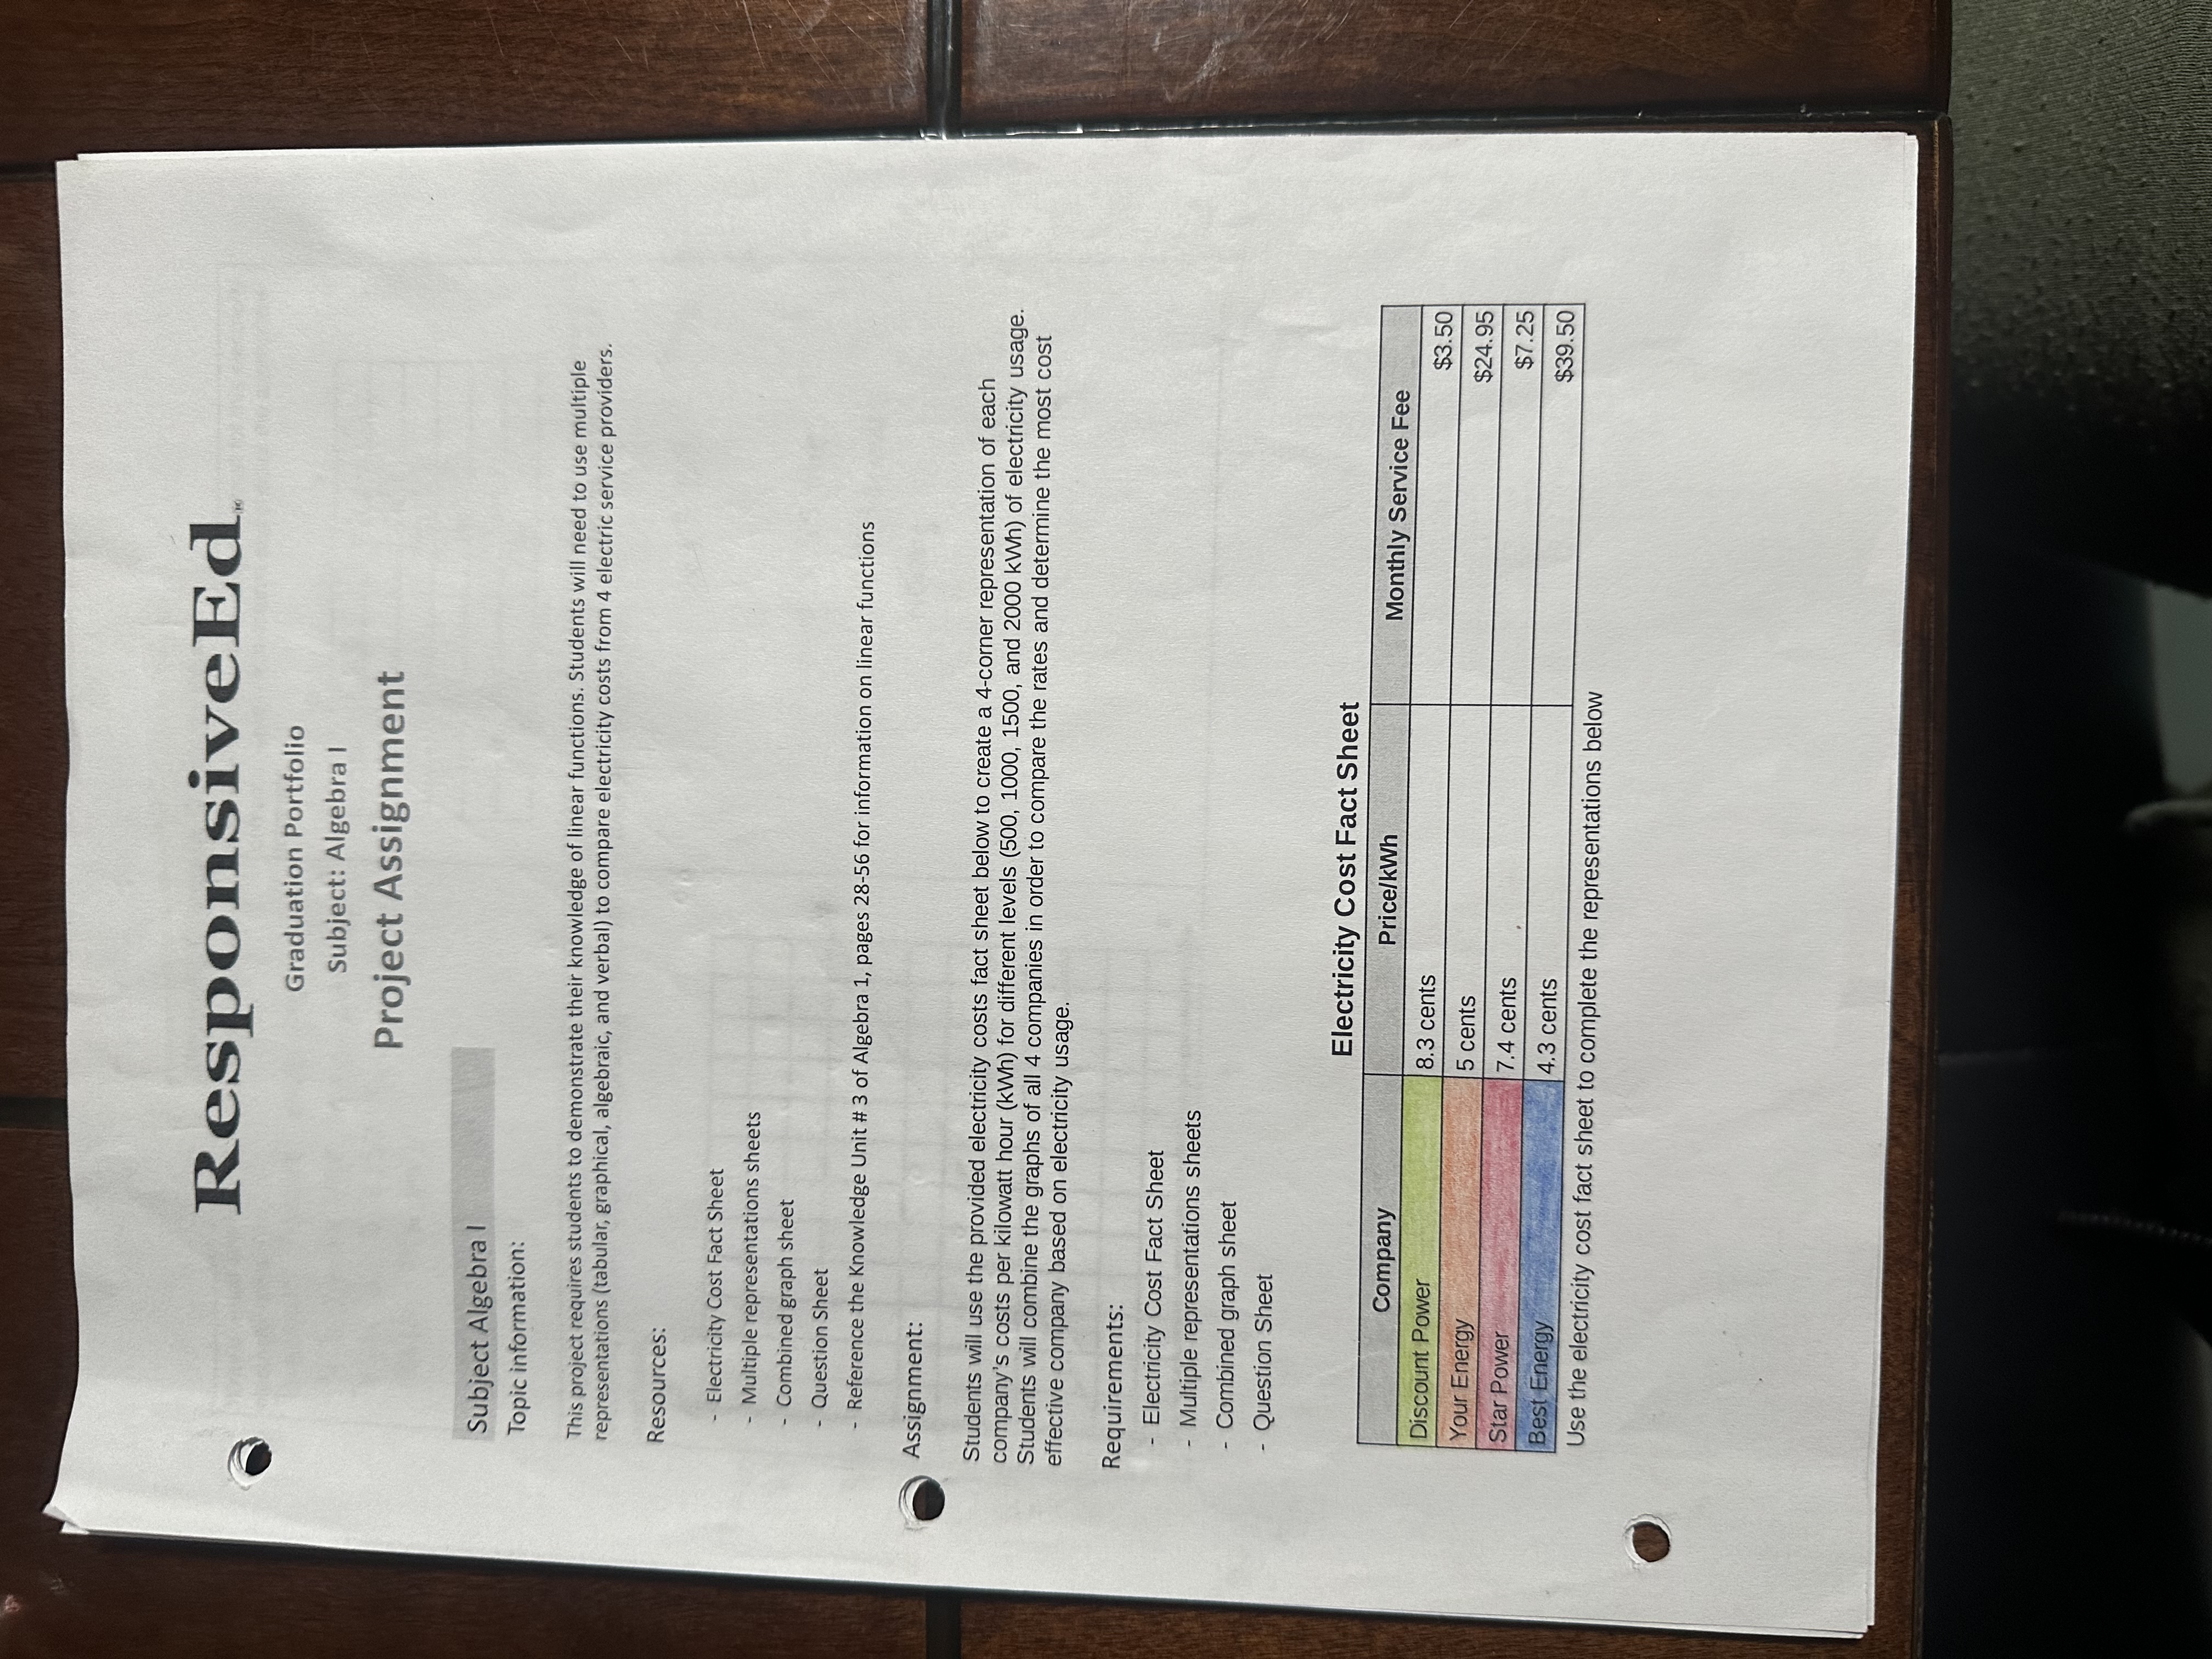
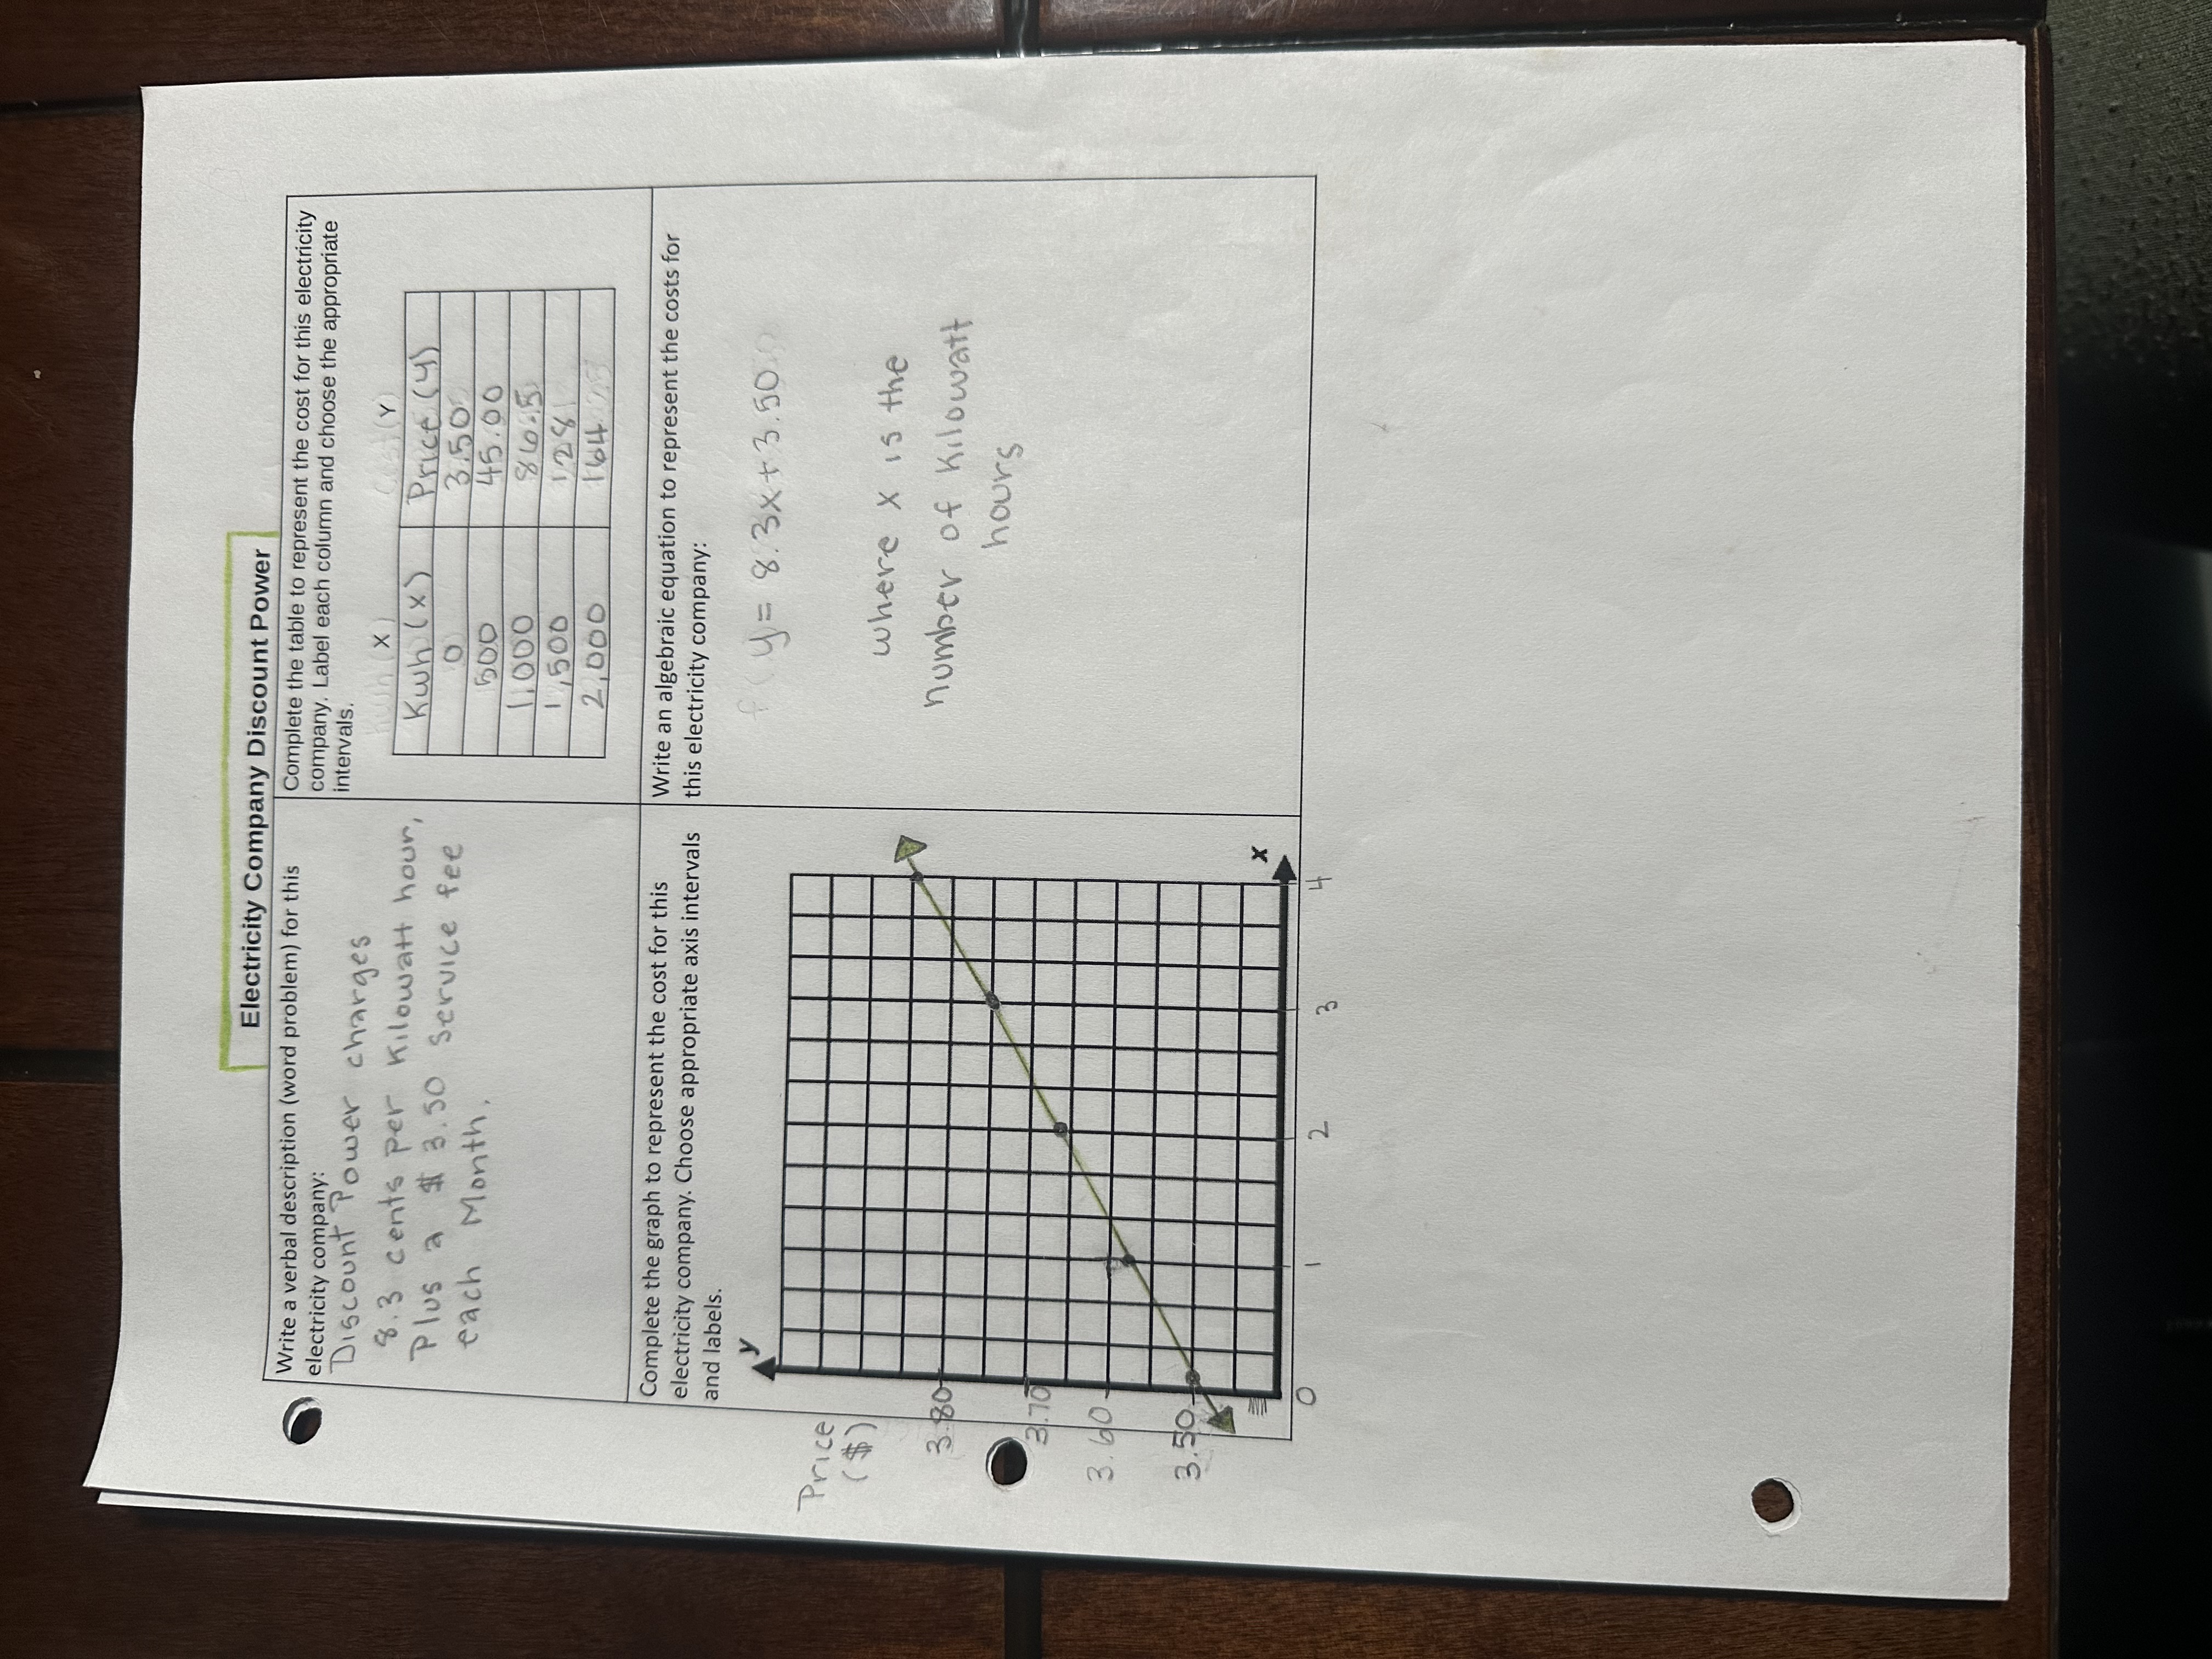
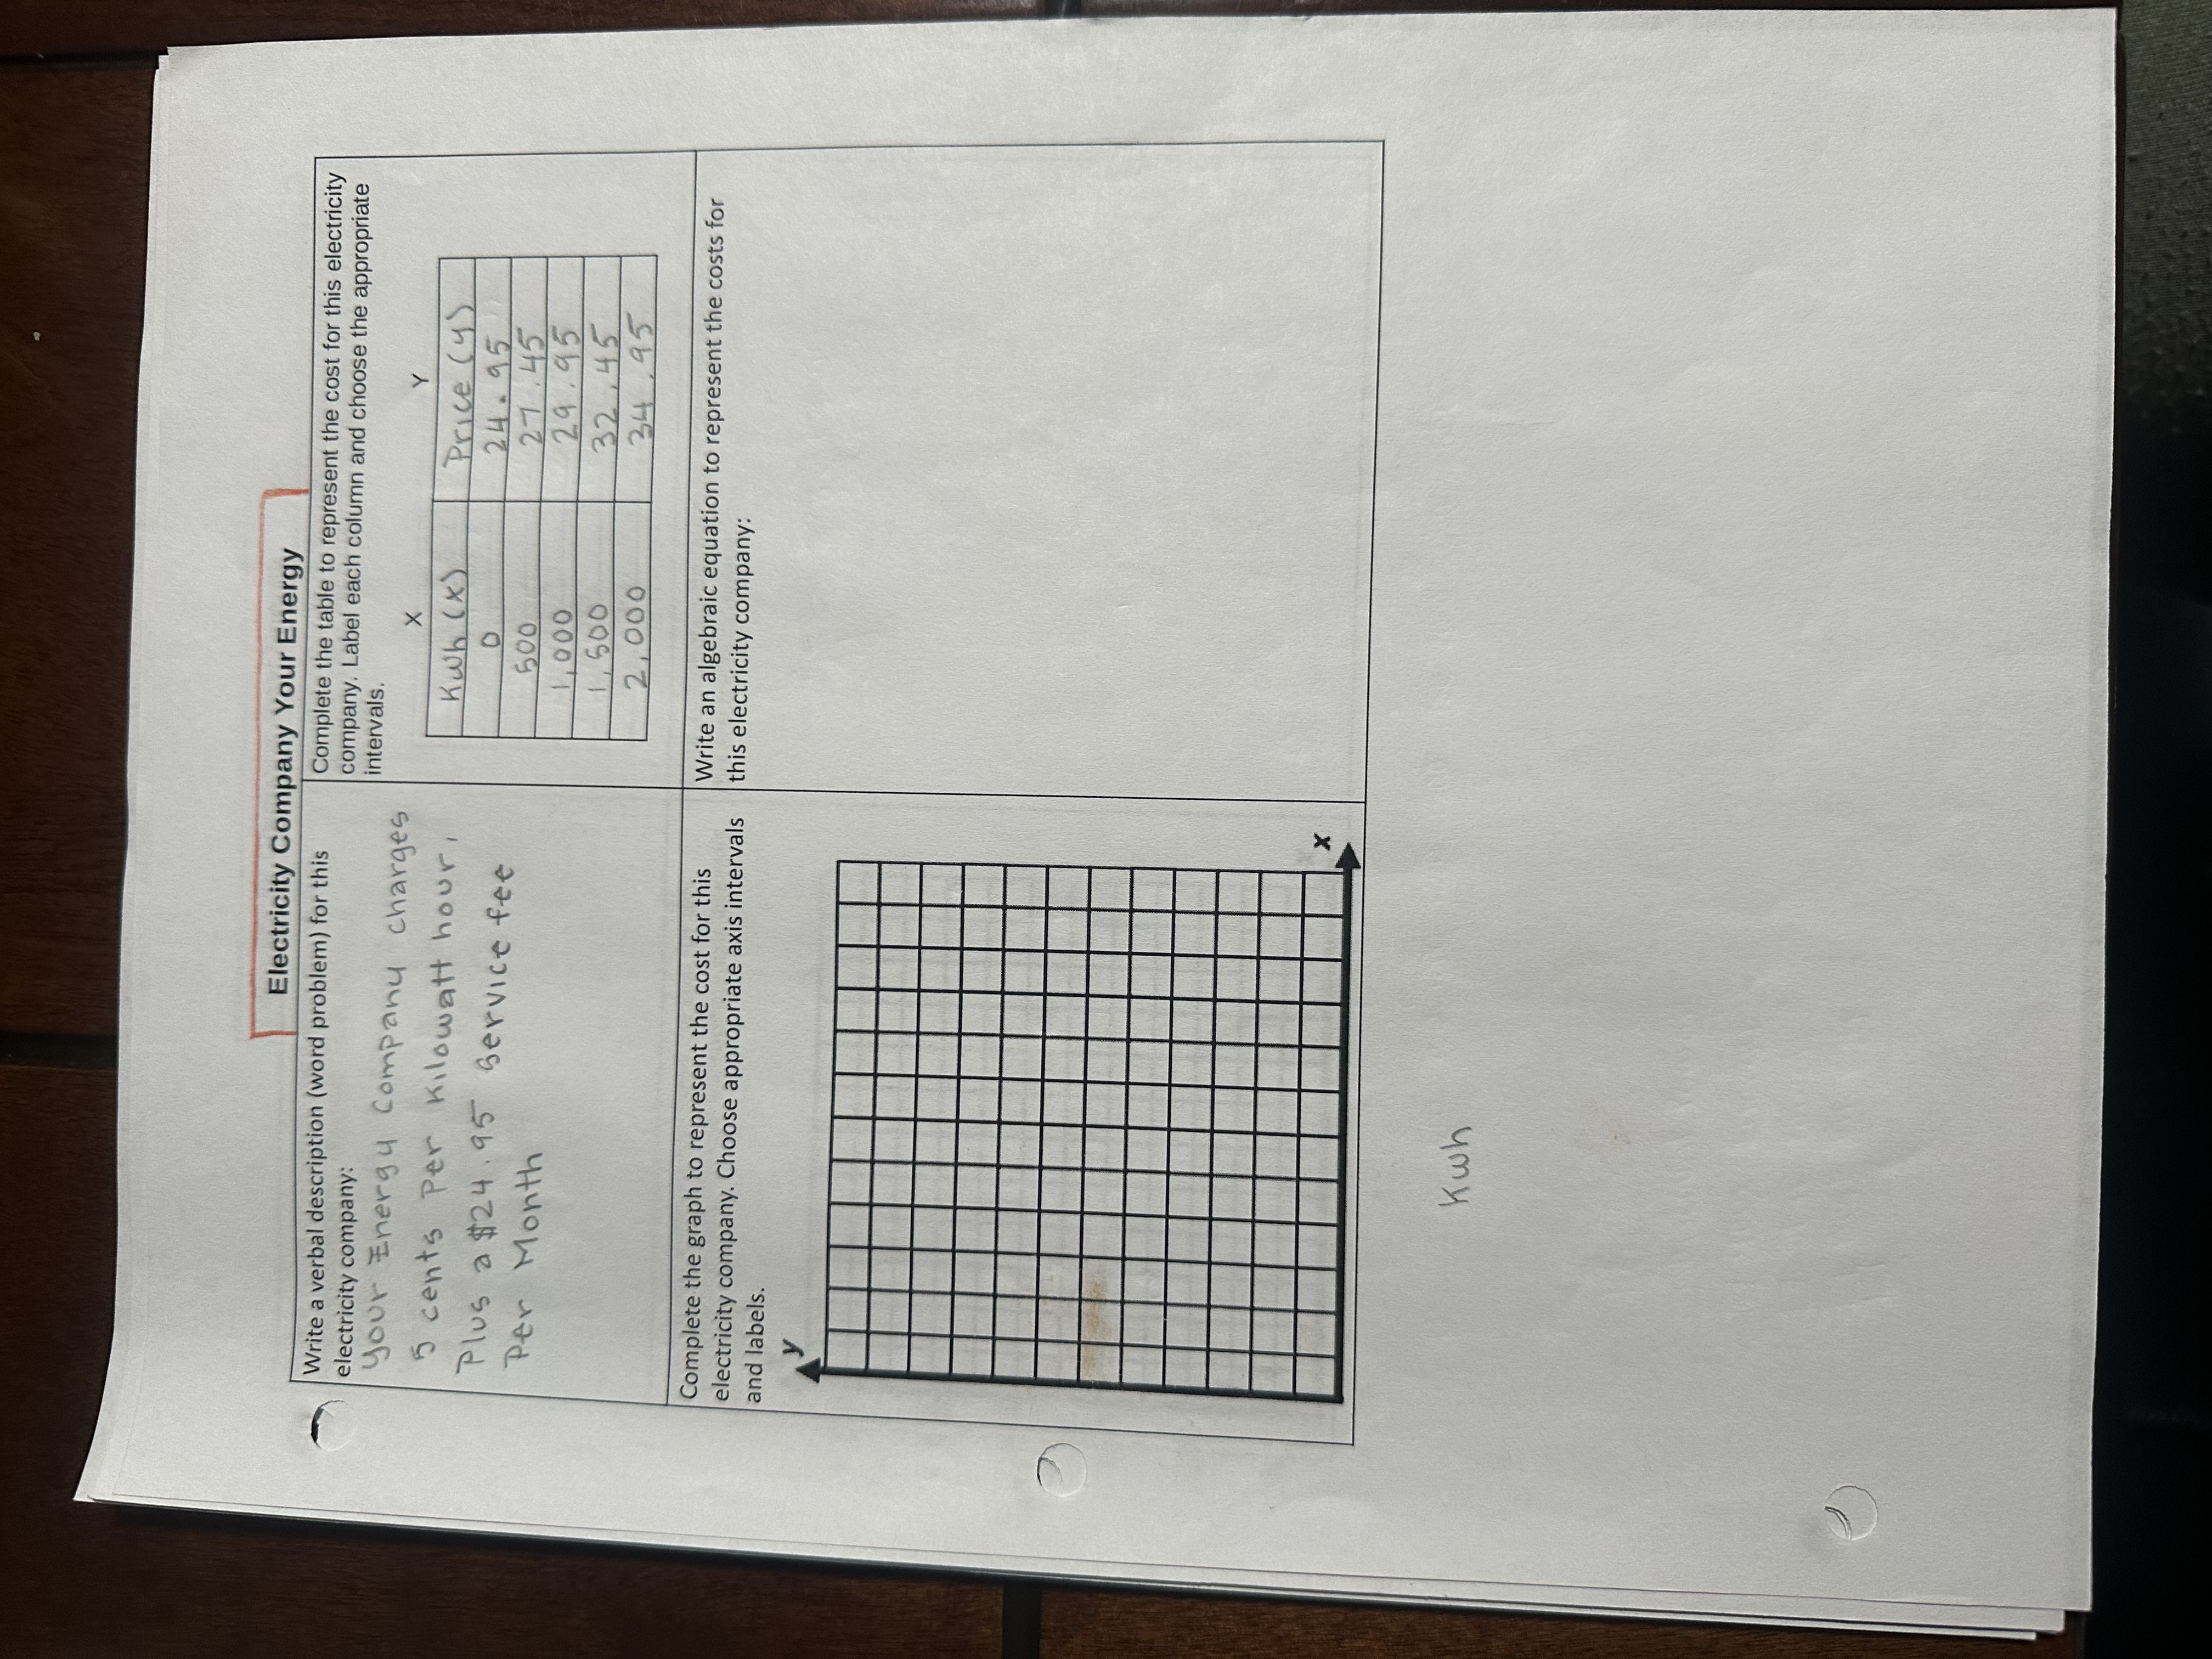
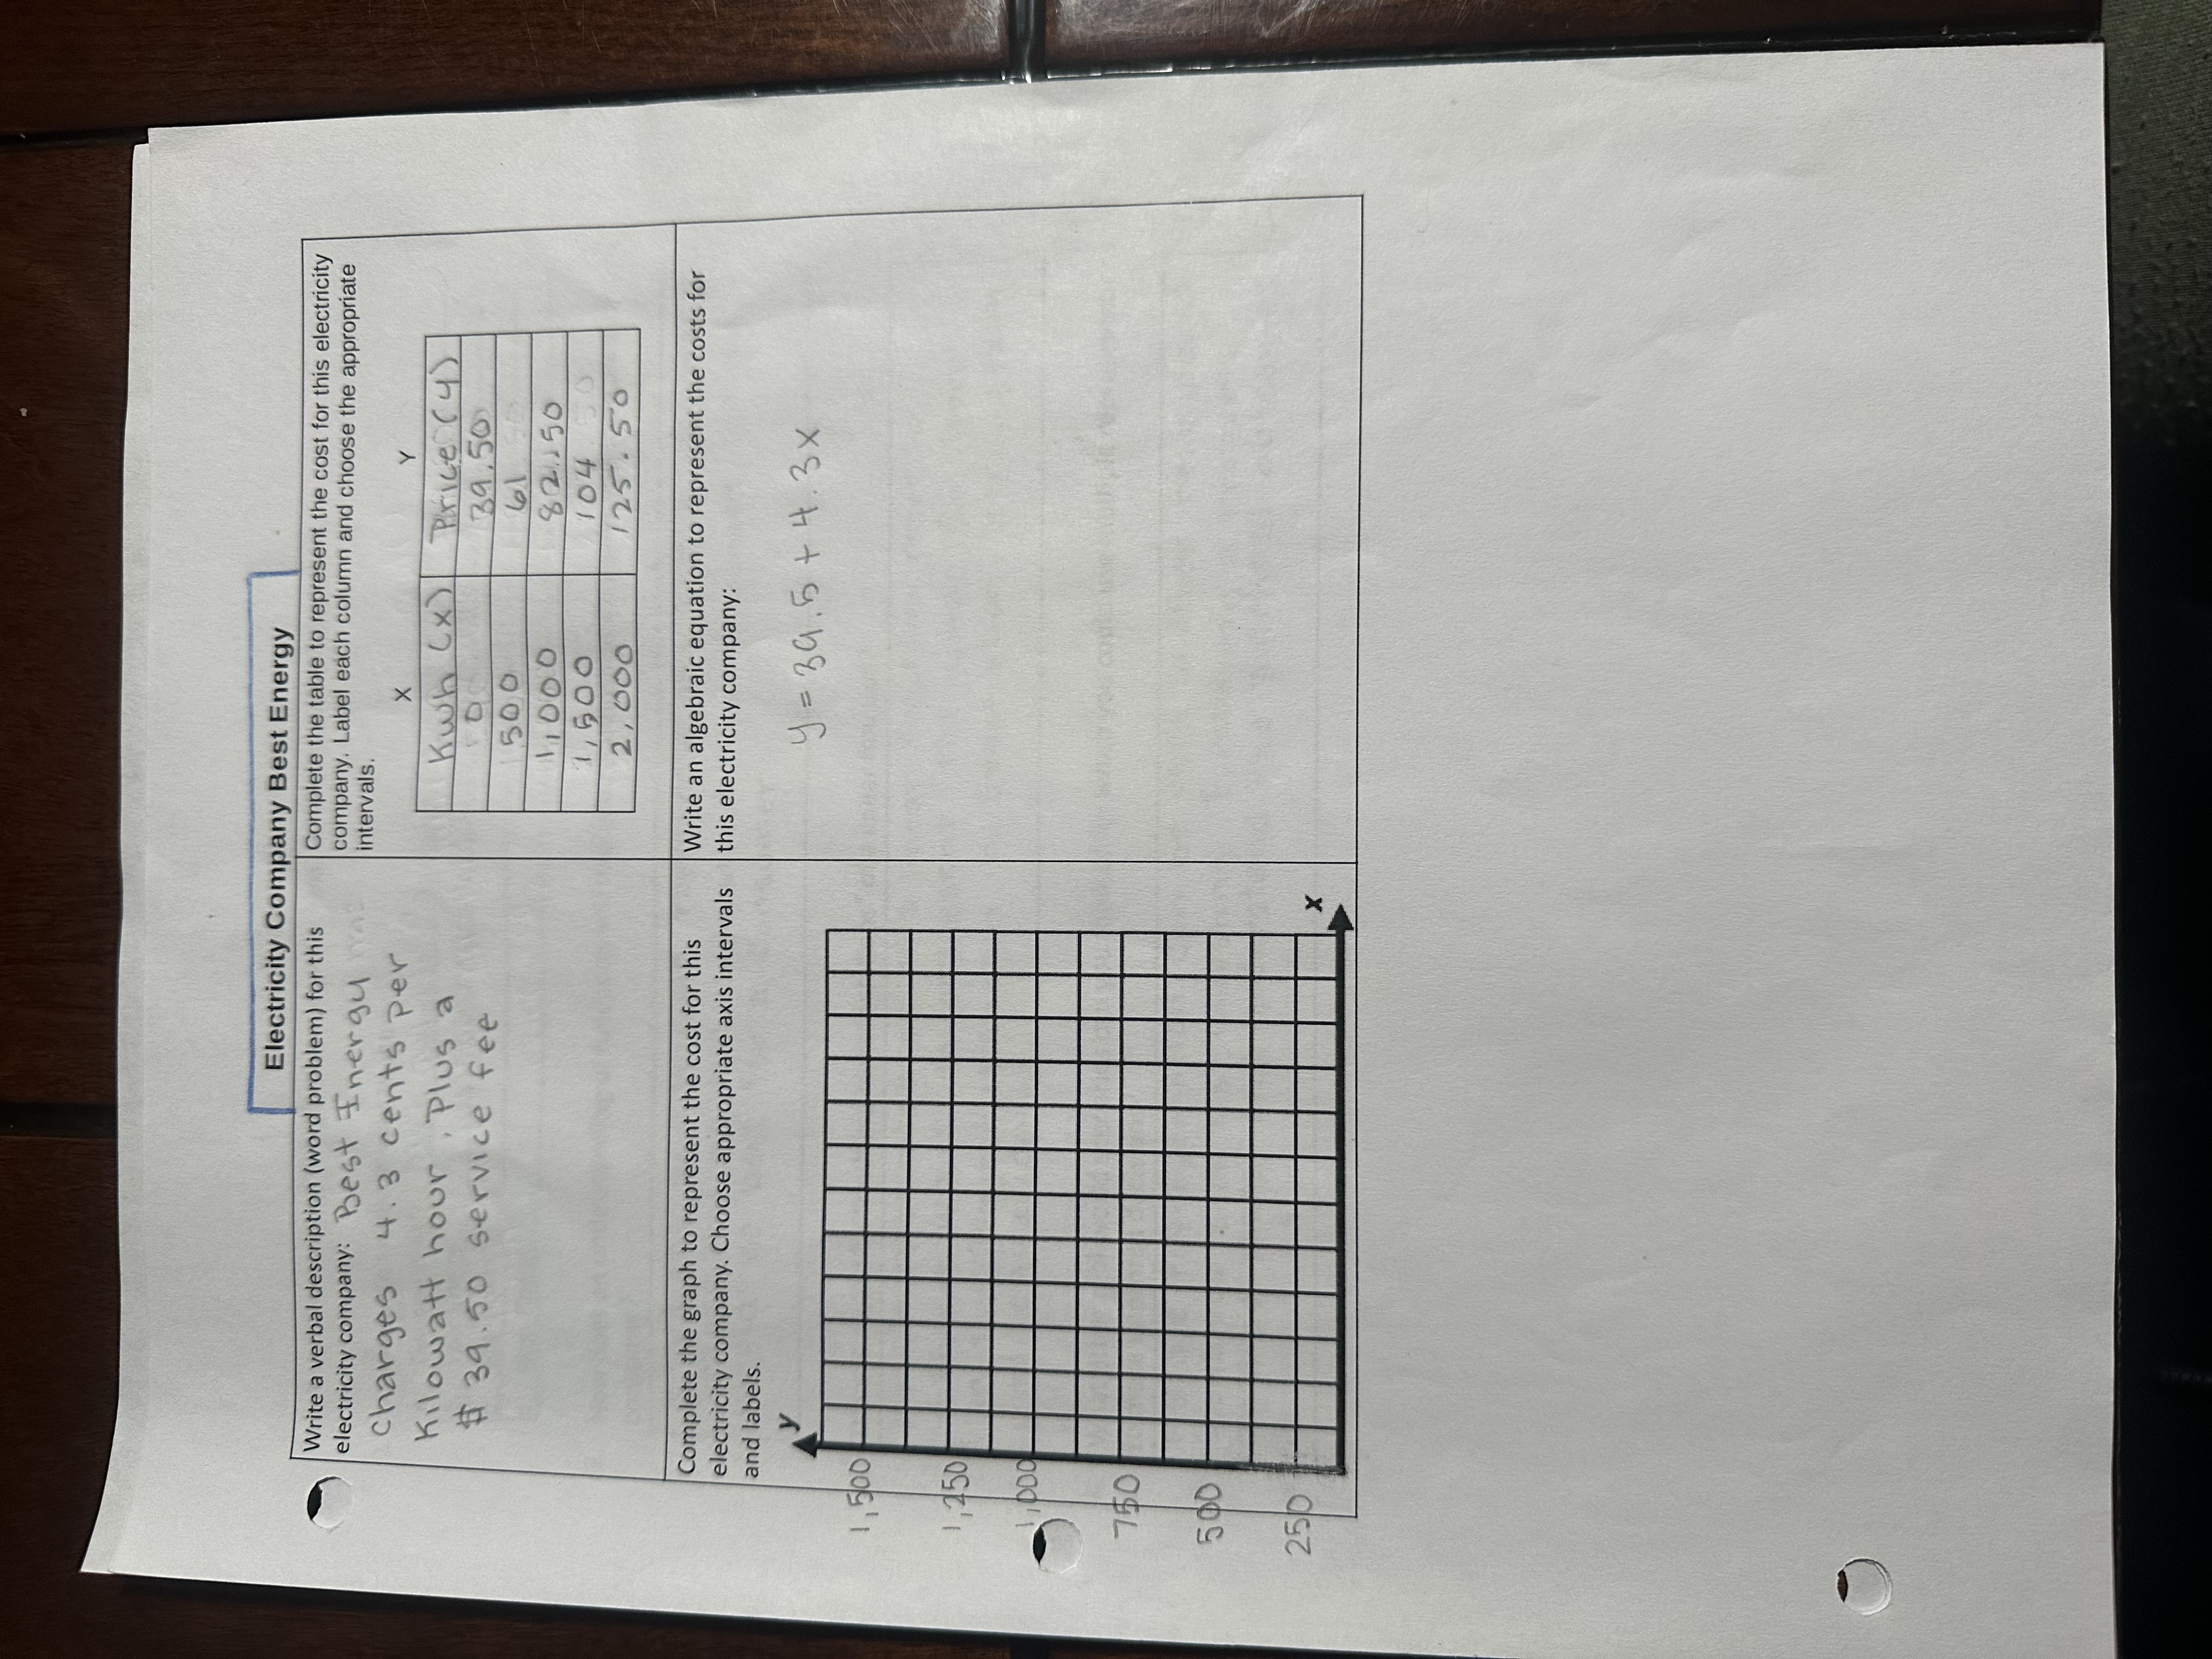
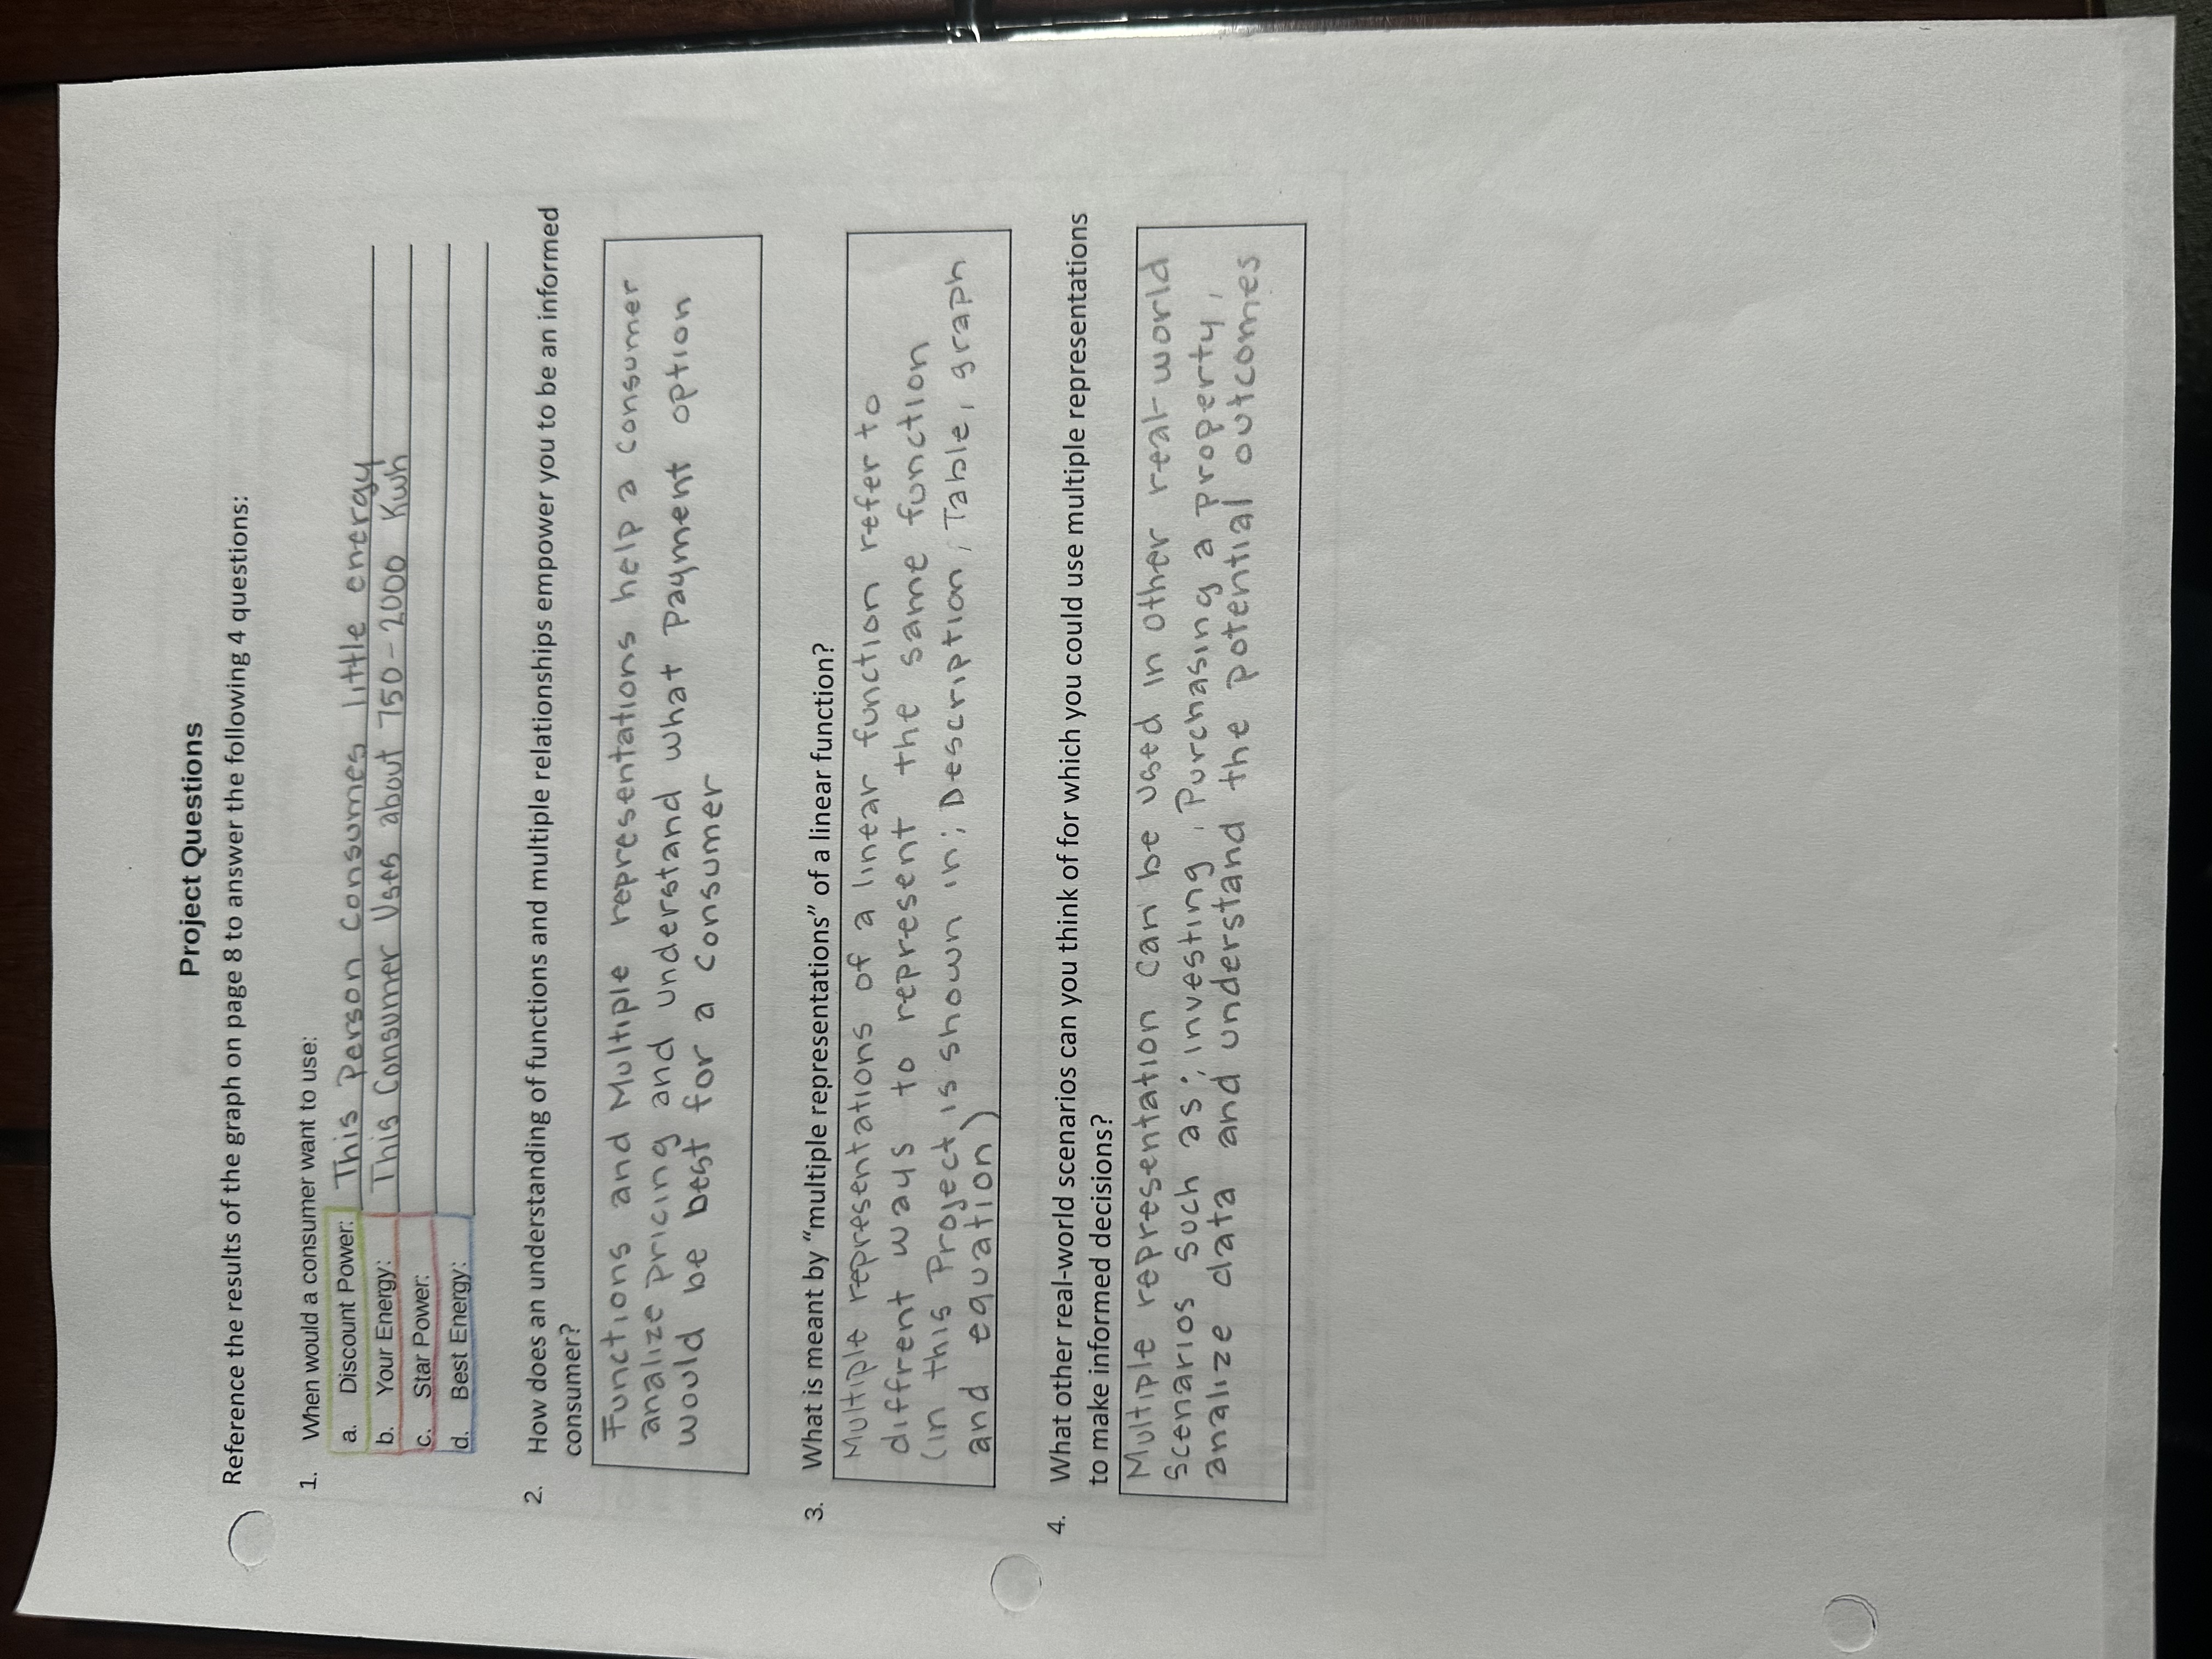
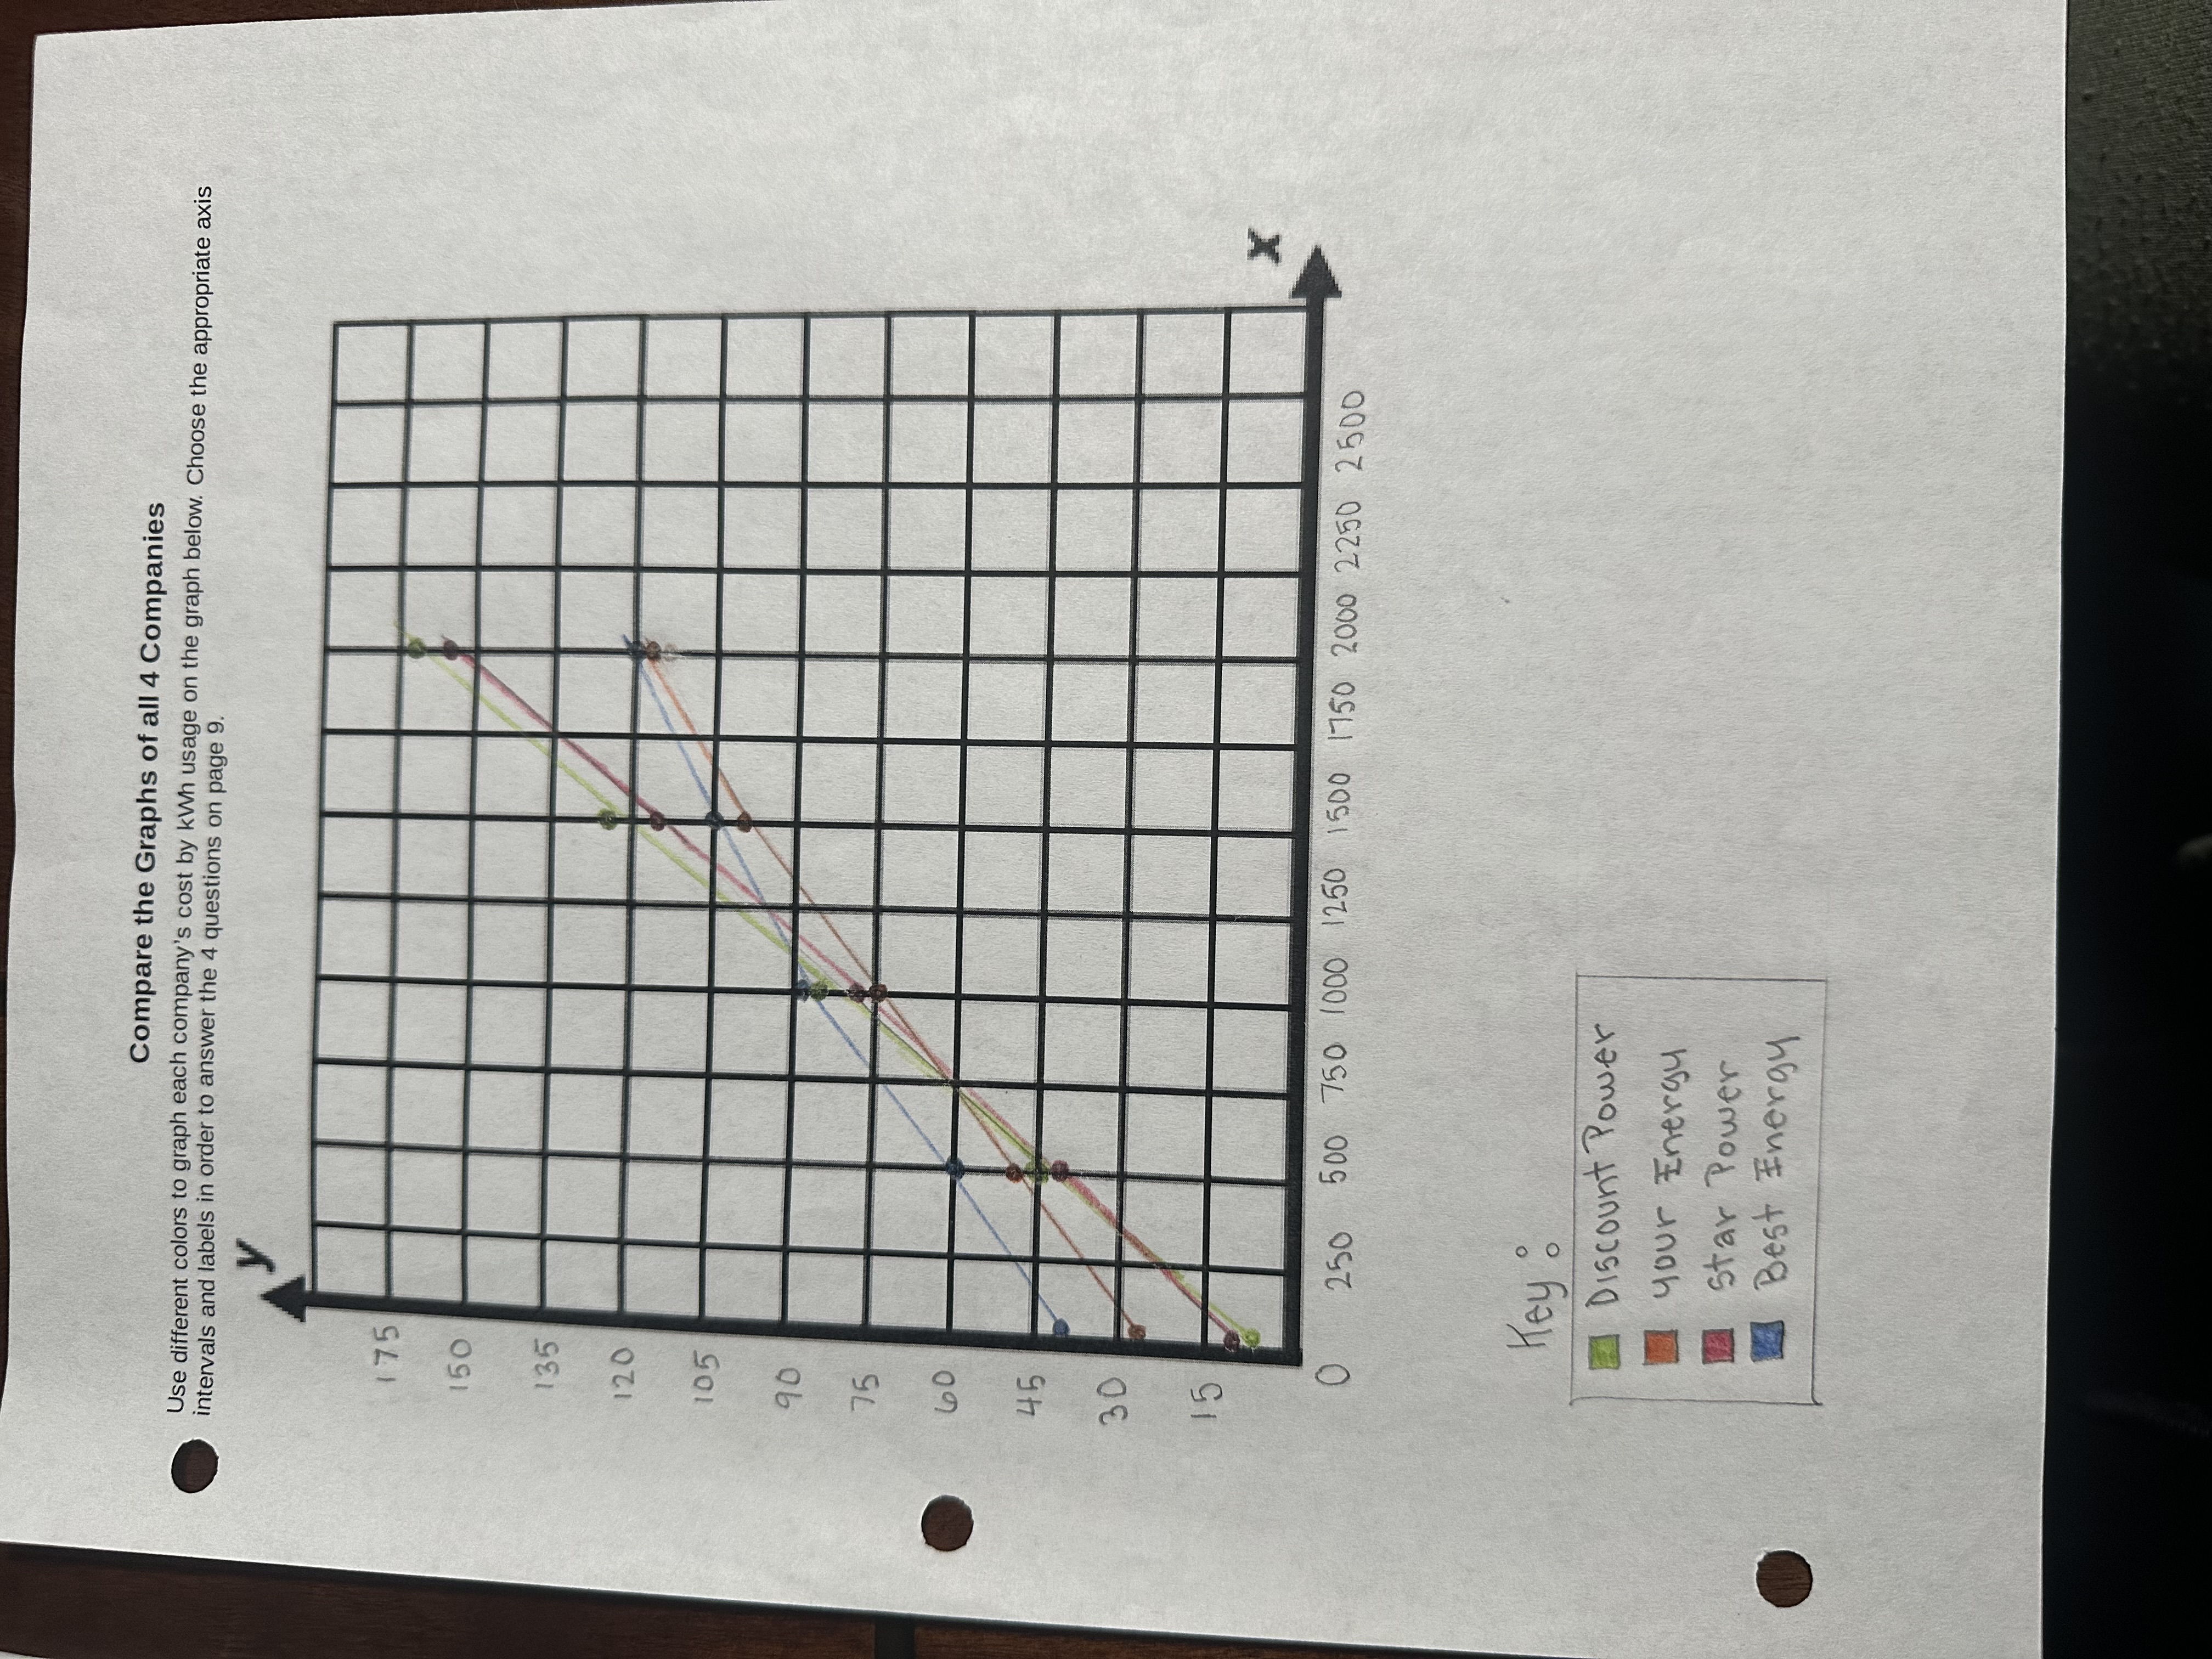
ResponsiveEd Graduation Portfolio Subject: Algebra I Project Assignment Subject Algebra I Topic information: This project requires students to demonstrate their knowledge of linear functions. Students will need to use multiple representations (tabular, graphical, algebraic, and verbal) to compare electricity costs from 4 electric service providers. Resources: Electricity Cost Fact Sheet - Multiple representations sheets Combined graph sheet Question Sheet Reference the Knowledge Unit # 3 of Algebra 1, pages 28-56 for information on linear functions Assignment: Students will use the provided electricity costs fact sheet below to create a 4-corner representation of each company's costs per kilowatt hour (KWh) for different levels (500, 1000, 1500, and 2000 KWh) of electricity usage. Students will combine the graphs of all 4 companies in order to compare the rates and determine the most cost effective company based on electricity usage. Requirements: Electricity Cost Fact Sheet Multiple representations sheets Combined graph shee - Question Shee Electricity Cost Fact Sheet Company Price/kWh Monthly Service Fee Discount Power 8.3 cents $3.50 Your Energy 5 cents $24.95 Star Power 7.4 cents $7.25 Best Energy 4.3 cents $39.50 Use the electricity cost fact sheet to complete the representations belowElectricity Company Discount Power Write a verbal description (word problem) for this Complete the table to represent the cost for this electricity electricity company: company. Label each column and choose the appropriate Discount Power charges intervals. 8. 3 cents per Kilowatt hour, Kwh ( x ) Price (4) Plus a $ 3.50 service fee O 350 each Month . 50:0 45. 00 1 500 124 2,000 Complete the graph to represent the cost for this Write an algebraic equation to represent the costs for electricity company. Choose appropriate axis intervals this electricity company: and labels. y = 8.3x + 3.50 0 Price where X is the 3.130 number of kilowatt hours 31.70 3. 60. 3.50- X O 2 13 4Electricity Company Your Energy Write a verbal description (word problem) for this Complete the table to represent the cost for this electricity electricity company: company. Label each column and choose the appropriate your Energy company charges intervals. 5 cents per Kilowatt hour, Kwh ( x ) Price (4) Plus 2$ 24. 95 service fee 24. 95 Per Month 500 27 45 1Ooo 29. 95 1/ 500 32 45 2, 000 34 , 95 Complete the graph to represent the cost for this Write an algebraic equation to represent the costs for electricity company. Choose appropriate axis intervals this electricity company: and labels. KwhElectricity Company Best Energy Write a verbal description (word problem) for this Complete the table to represent the cost for this electricity electricity company: Best Energy company. Label each column and choose the appropriate intervals. charges 4.3 cents per X Kilowatt hour , Plus a Kwh ( x ) Price ( 4 ) # 39. 50 service fee 39. 50 500 41 11000 8 2.150 1, 500 104 2, 000 125. 50 Complete the graph to represent the cost for this Write an algebraic equation to represent the costs for electricity company. Choose appropriate axis intervals this electricity company: and labels. J = 39.5 + 4. 3 x 1 500 250 DOO 750 500 250Project Questions Reference the results of the graph on page 8 to answer the following 4 questions: When would a consumer want to use: a. Discount Power: This Person Consumes little energy b. Your Energy: This Consumer Uses about 750 - 2000 Kwh c. Star Power: d. Best Energy: 2. How does an understanding of functions and multiple relationships empower you to be an informed consumer? Functions and Multiple representations help a consumer analize pricing and understand what payment option would be best for a consumer 3. What is meant by "multiple representations" of a linear function? Multiple representations of a linear function refer to diffrent ways to represent the same function (In this Project is shown in; Description , Table, graph and equation 4. What other real-world scenarios can you think of for which you could use multiple representations to make informed decisions? Multiple representation can be used in other real world Scenarios such as; investing, Purchasing a property, analize data and understand the potential outcomesCompare the Graphs of all 4 Companies Use different colors to graph each company's cost by KWh usage on the graph below. Choose the appropriate axis ntervals and labels in order to answer the 4 questions on page 9. y 175 150 135 120 105 90 75 60 45 30 15 X 0 250 500 750 1000 1250 1500 1750 2000 2250 2500 Hey . Discount Power your Energy Star Power Best Energy
Step by Step Solution
There are 3 Steps involved in it

Get step-by-step solutions from verified subject matter experts