Question: Where Do We Draw The Line? As Cecil shuffled through the stack of files on his desk and clicked away on his mouse, his mind
Where Do We Draw The Line?
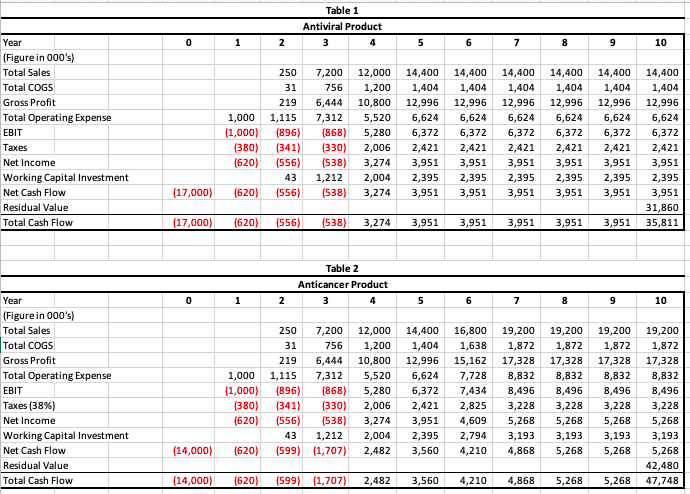
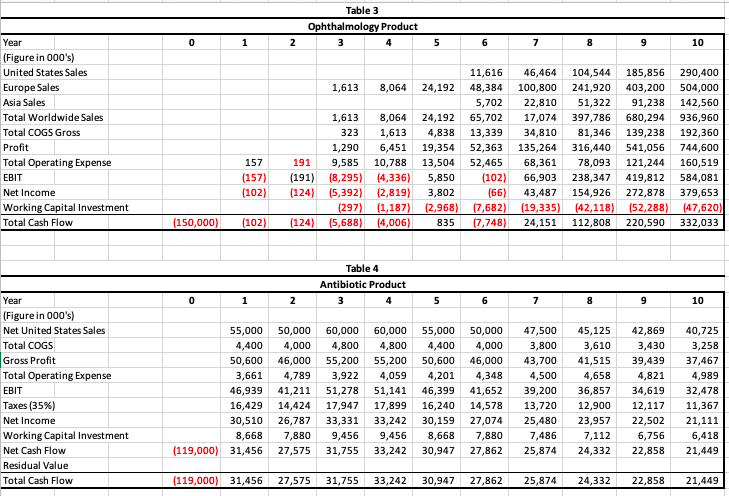
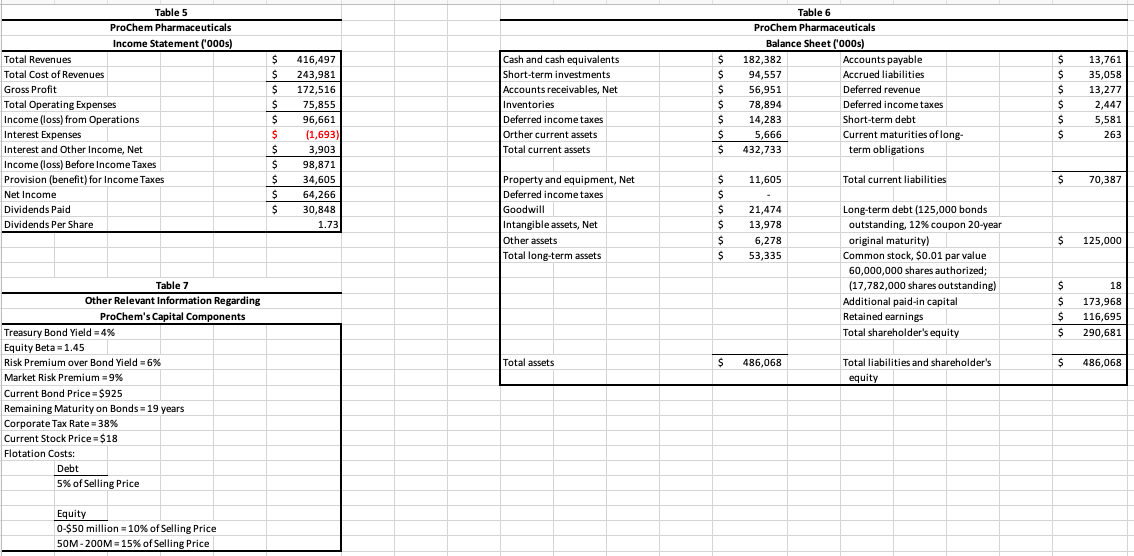
As Cecil shuffled through the stack of files on his desk and clicked away on his mouse, his mind kept racing back to what Jason, his boss, had said to him at the last budget meeting. "We can only fund two or three new projects over the next year," he said, "And up to a maximum capital investment of around $275 million. You've got to be highly selective," he cautioned. "The analysts have been rather critical of our last two product acquisitions, and our stock price does not need any further jolts!" Cecil Nazareth was the business development manager for ProChem Pharmaceuticals, a fairly large company with manufacturing facilities in four countries and sales and research and development centers all over the world. He had seen the firm go through two major restructurings during his 20-year career with ProChem and was instrumental in making a number of their product acquisition decisions. Cecil reported directly to the chief financial officer, Jason Schmidt, who had been recently moved into that position as a result of their last merger.The firm had gone through a series of "right-sizing" attempts and managerial transformations in recent years. Somehow, Cecil had survived it all. Obviously, his smart decisions and sharp foresight had served him well over the years. Unfortunately, their last merger had taken its toll on the company's stock price. With a number of the firm's patents expiring in the next three years, and most of its products far from getting final FDA approval, there was pressure to expand the product line. As a result, the last couple of product acquisitions were made rather hastily, at the insistence of the prior CFO, Bill Piper, despite Cecil's negative comments and concerns. One thing that Cecil had consistently warned against was the use of an arbitrary hurdle rate when deciding on new product acquisitions. Cecil was a firm believer in the use of the weighted average cost of capital (WACC) when evaluating project cash flows. Bill, on the other hand, preferred to use a baseline rate of 13% and would begin negotiations at a discount rate of 20%. While this strategy had resulted in a few good acquisitions, Cecil, was aware that sooner or later it would come back to haunt them. Their last two acquisitions, an anti-inflammatory drug, BruPain, and an anti-allergy medication, Immunol, were made using a discount rate assumption of 14%. Cecil was highly skeptical because he felt that with their 20-year bonds selling to yield 12.69% at that time, 14% would be too low to cover the 6% risk premium that analysts had typically required on the firm's equity. "We'll get by with debt financing on these two acquisitions," was Bill's way of justifying the decision, paying little heed to Cecil's concerns. "We have to get some more products in our portfolio," he remarked. After the announcement of ProChem's last merger with Standard Chemicals, Bill Piper took early retirement, and was replaced by Jason Schmidt, who had been serving as Standard Chemicals' VP of finance. Unlike Bill, Jason preferred to be more objective and selective when evaluating new product acquisitions. He had heard about Bill's arbitrary investment decision rule and had made it a point to tell Cecil that he disagreed with it. "I would rather that you estimate the firm's marginal cost of capital using market value weights and flotation costs," he had said to Cecil during one of their earlier discussions. "It has worked really well for us at Standard Chemicals," he said with pride. "I totally agree," Cecil had replied, "I have been trying to convince Bill for years, but he would not buy it," he said shrugging his shoulders. At Jason's request, Cecil had set up a project team and asked them to come up with some proposals for acquisitions. "Use a 10-year forecast," he recommended, "and figure out what the residual value will be after 10 years." After careful analysis, the project team had come up with four recommendations: an ophthalmology product, an antiviral drug, an anticancer medication, and an antibiotic. The detailed projections and other relevant information are shown in Tables 1-7 below. All four products had fairly good projections and looked profitable over the 10-year horizon, but having been burned the last two times, Cecil couldn't help wondering, "Where do we draw the line?"
Table 1 Antiviral Product Year 1 2 3 5 6 7 9 10 (Figure in 000's) Total Sales 250 7,200 12,000 14,400 14,400 14,400 14,400 14,400 14,400 Total COGS 31 756 1,200 1,404 1,404 1,404 1,404 1,404 1,404 Gross Profit 219 6,444 10,800 12,996 12,996 12,996 12,996 12,996 12,996 Total Operating Expense 1,000 1,115 7,312 5,520 6,624 6,624 6,624 6,624 6,624 6,624 EBIT (1,000) (896) (868) 5,280 6,372 6,372 6,372 6,372 6,372 6,372 Taxes (380] (341) (330) 2,006 2,421 2,421 2,421 2,421 2,421 2,421 Net Income (620) (556] (538) 3,274 3,951 3.951 3,951 3,951 3,951 3,951 Working Capital Investment 43 1,212 2,004 2,395 2,395 2,395 2,395 2,395 2,395 Net Cash Flow (17,000) (620) (556) (538) 3,274 3,951 3,951 3,951 3,951 3,951 3,951 Residual Value 31,860 Total Cash Flow (17,000) (620) (556) [538) 3,274 3,951 3,951 3,951 3,951 3,951 35,811 Table 2 Anticancer Product Year 1 2 3 5 6 7 9 10 (Figure in 000's) Total Sales 250 7,200 12,000 14,400 16,800 19,200 19,200 19,200 19,200 Total COGS 31 756 1,200 1,404 1,638 1,872 1,872 1,872 1,872 Gross Profit 219 6,444 10,800 12,996 15,162 17,328 17,328 17,328 17,328 Total Operating Expense 1,000 1,115 7,312 5,520 6,624 7,728 8,832 8,832 8,832 8,832 EBIT (1,000) (896) (868) 5,280 6,372 7,434 8,496 8,496 8,496 8,496 Taxes (38%) (380) (341) (330) 2,006 2,421 2,825 3,228 3,228 3,228 3,228 Net Income (620) (556) (538) 3,274 3,951 4,609 5,268 5,268 5,268 5,268 Working Capital Investment 43 1,212 2,004 2,395 2,794 3,193 3,193 3,193 3,193 Net Cash Flow (14,000) (620) (599) (1,707) 2,482 3,560 4,210 4,868 5,268 5,268 5,268 Residual Value 12,480 Total Cash Flow [14,000) (620) (599) (1,707) 2,482 3,560 4,210 4,868 5,268 5,268 47,748Table 3 Ophthalmology Product Year 1 2 3 4 5 6 7 8 9 10 (Figure in 000's) United States Sales 11,616 46,464 104,544 185,856 290,400 Europe Sales 1,613 8,064 24,192 48,384 100,800 241,920 403,200 504,000 Asia Sales 5,702 22,810 51,322 91,238 142,560 Total Worldwide Sales 1,613 8,064 24,192 65,702 17,074 397,786 680,294 936,960 Total COGS Gross 323 1,613 4,838 13,339 34,810 81,346 139,238 192,360 Profit 1,290 6,451 19,354 52,363 135,264 316,440 541,056 744,600 Total Operating Expense 157 191 9,585 10,788 13,504 52,465 68,361 78,093 121,244 160,519 EBIT (157) (191) (8,295) (4,336) 5,850 [102) 66,903 238,347 419,812 584,081 Net Income [102) (124) (5,392) (2,819) 3,802 [66) 43,487 154,926 272,878 379,653 Working Capital Investment (297) (1,187) (2,968] (7,682) (19,335) (42,118) (52,288) (47,620) Total Cash Flow (150,000 (102) [124) (5,688) (4,006) 835 (7,748) 24,151 112,808 220,590 332,033 Table 4 Antibiotic Product Year 0 1 2 3 4 5 6 7 8 9 10 (Figure in 000's) Net United States Sales 55,000 50,000 60,000 60,000 55,000 50,000 47,500 45,125 42,869 40,725 Total COGS 4,400 4,000 4,800 4,800 4,400 4,000 3,800 3,610 3,430 3,258 Gross Profit 50,600 46,000 55,200 55,200 50,600 46,000 43,700 41,515 39,439 37,467 Total Operating Expense 3,661 4,789 3,922 4,059 4,201 4,348 4,500 4,658 4,821 4,989 EBIT 46,939 41,211 51,278 51,141 46,399 41,652 39,200 36,857 34,619 32,478 Taxes (35%%) 16,429 14,424 17,947 17,899 16,240 14,578 13,720 12,900 12,117 11,367 Net Income 30,510 26,787 33,331 33,242 30,159 27,074 25,480 23,957 22,502 21,111 Working Capital Investment 8,668 7,880 9,456 9,456 8,668 7,880 7,486 7,112 6,756 6,418 Net Cash Flow (119,000) 31,456 27,575 31,755 33,242 30,947 27,862 25,874 24,332 22,858 21,449 Residual Value Total Cash Flow (119,000) 31,456 27,575 31,755 33,242 30,947 27,862 25,874 24,332 22,858 21,449Table 5 Table 6 ProChem Pharmaceuticals ProChem Pharmaceuticals Income Statement ('000s) Balance Sheet ('000s) Total Revenues 416,497 Cash and cash equivalents 182,382 Accounts payable 13,761 Total Cost of Revenues 243,981 Short-term investments 94,557 Accrued liabilities 35,058 Gross Profit 172,516 Accounts receivables, Net 56,951 Deferred revenue 13,277 Total Operating Expenses 75,855 Inventories 78,894 Deferred income taxes 2,447 Income (loss) from Operations 96,661 Deferred income taxes 14,283 Short-term debt 5,581 Interest Expenses (1,693) Orther current assets 5,666 Current maturities of long- 263 Interest and Other Income, Net 3,903 Total current assets S 432,733 term obligations Income (loss) Before Income Taxes 98,871 Provision (benefit) for Income Taxes 34,605 Property and equipment, Net 11,605 Total current liabilities 70,387 Net Income 64,266 Deferred income taxes Dividends Paid 30,848 Goodwill 21,474 Long-term debt (125,000 bonds Dividends Per Share 1.73 Intangible assets, Net 13,978 outstanding, 12% coupon 20-year Other assets 6,278 original maturity) 125,000 Total long-term assets 53,335 Common stock, $0.01 par value 60,000,000 shares authorized; Table 7 (17,782,000 shares outstanding) 18 in in in Other Relevant Information Regarding Additional paid-in capital 173,968 ProChem's Capital Components Retained earnings 116,695 Treasury Bond Yield =4% Total shareholder's equity 290,681 Equity Beta = 1.45 Risk Premium over Bond Yield = 6% Total assets S 486,068 Total liabilities and shareholder's $ 486,068 Market Risk Premium = 9% equity Current Bond Price = $925 Remaining Maturity on Bonds = 19 years Corporate Tax Rate = 38% Current Stock Price = $18 Flotation Costs: Debt 5% of Selling Price Equity 0-$50 million = 10% of Selling Price 50M-200M=15% of Selling Price