

Question: Where is the correlation between 1 and 7 in this table? Means, standard deviations and intercorrelations for the SARTvariab1es, RVIP, and CFQ. SART 1. NOGO
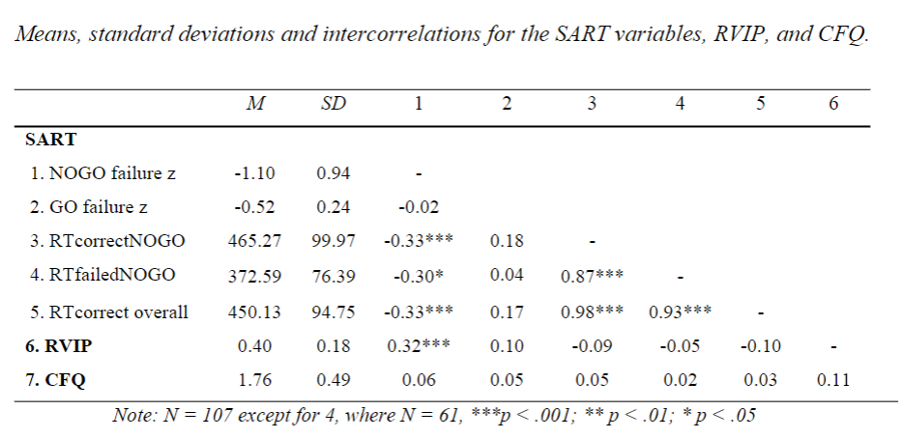
Where is the correlation between 1 and 7 in this table?

Means, standard deviations and intercorrelations for the SARTvariab1es, RVIP, and CFQ. SART 1. NOGO failure z 2. GO failure z 3. RTconectNOGO 4. RTfai1edNOGO 5. RTcorrect overall 6. RVIP 7. CFQ Note. M -1.10 -0.52 465.27 372.59 450.13 0.40 1.76 SD 0.94 024 99.97 76.39 94.75 0.18 0.49 -0.02 0.33* -0.30* 0.33 0.06 2 0.18 0.17 0.10 0.05 3 -0.09 0.05 .001; 4 0.93 -0.05 0.02 < .01; *p < -0.10 0.03 .05 6 0.11 107 except for 4, M'hereN 61,
Step by Step Solution
There are 3 Steps involved in it
1 Expert Approved Answer
Step: 1 Unlock

Question Has Been Solved by an Expert!
Get step-by-step solutions from verified subject matter experts
Step: 2 Unlock
Step: 3 Unlock