

Question: Which frequency table is consistent with the histogram of weights of 86 different students, below? Histogram of Weights 30 25 20 15 850 105.0 1250
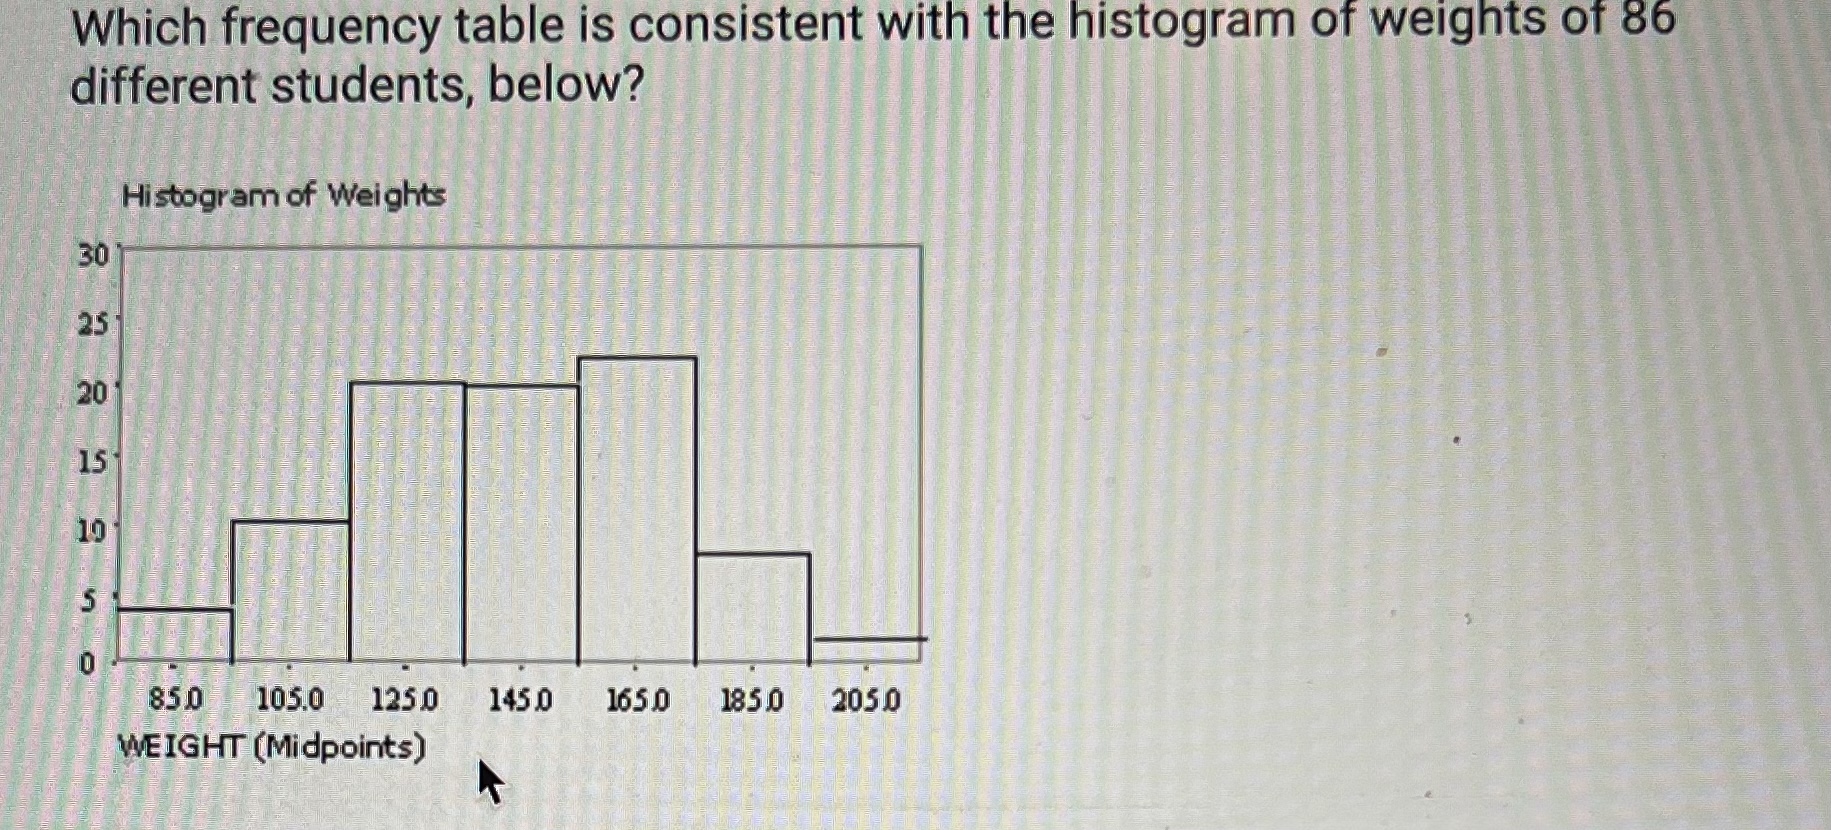
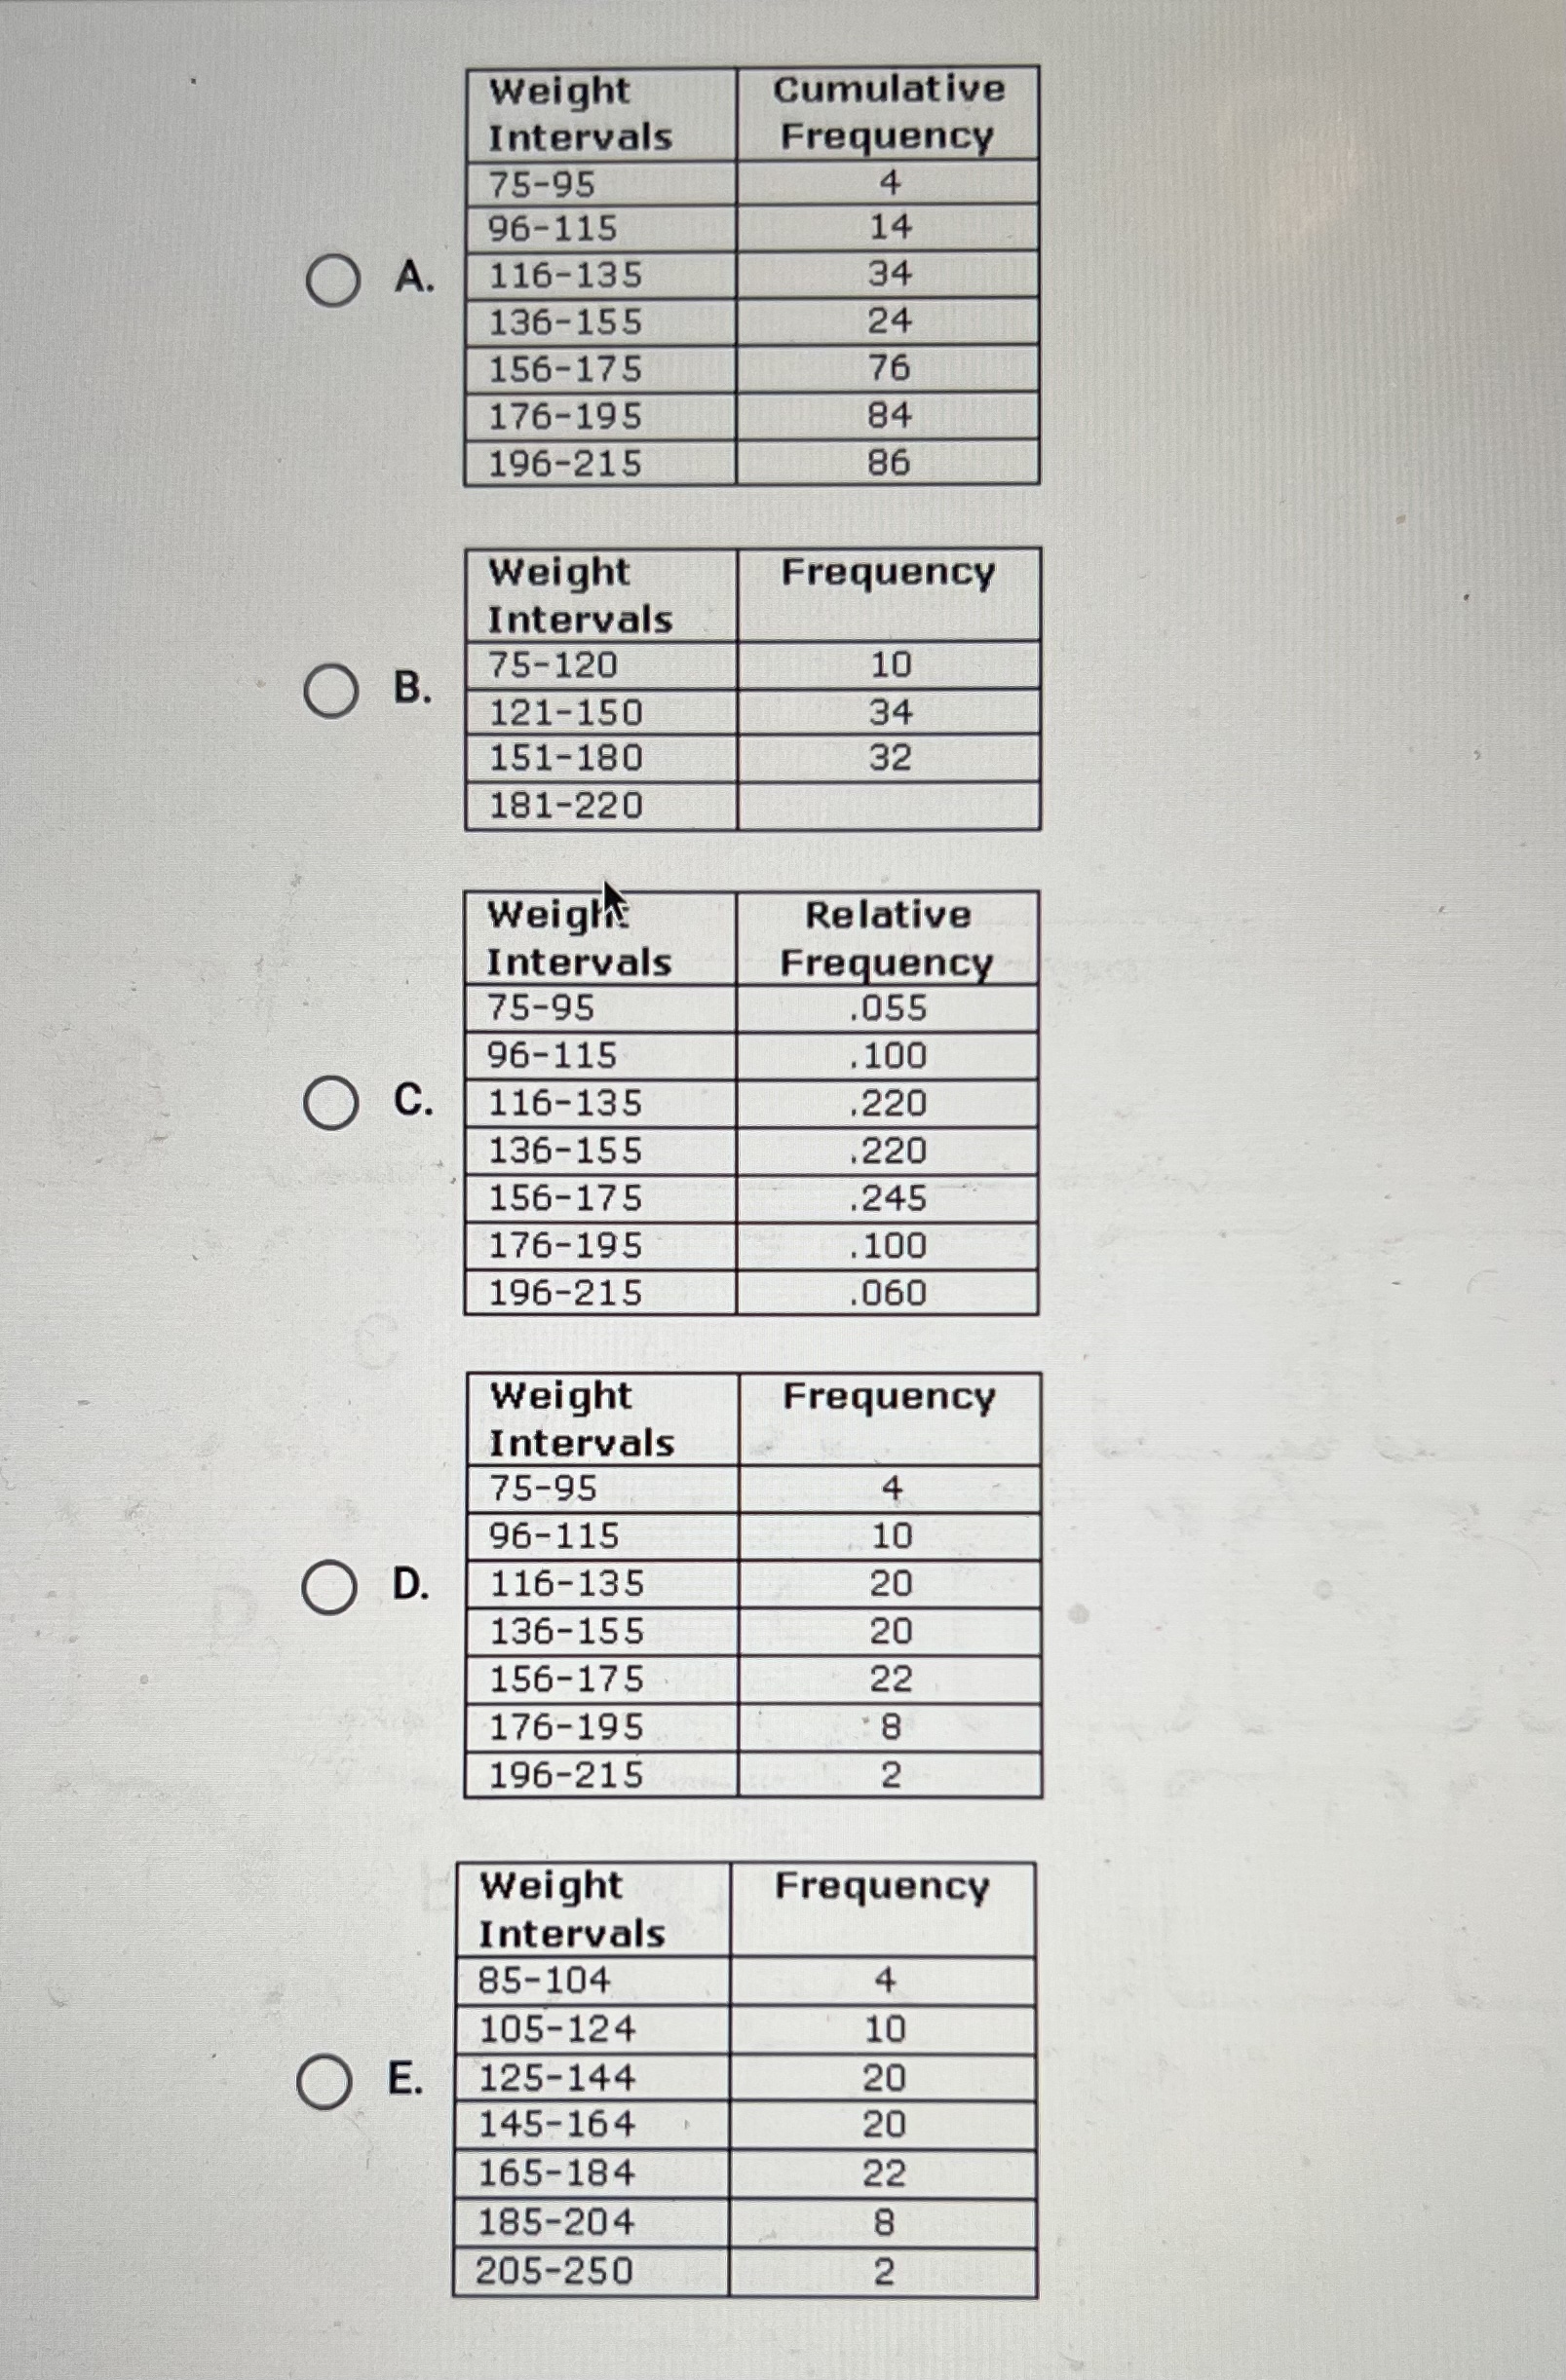


Which frequency table is consistent with the histogram of weights of 86 different students, below? Histogram of Weights 30 25 20 15 850 105.0 1250 1450 1650 1850 2050 WEIGHT (Midpoints)Weight Cumulative Intervals Frequency 75-95 4 96-115 14 O A. 116-135 34 136-155 24 156-175 76 176-195 84 196-215 86 Weight Frequency Intervals O B. 75-120 10 121-150 34 151-180 32 181-220 Weight Relative Intervals Frequency 75-95 055 96-115 100 O c. 116-135 220 136-155 220 156-175 245 176-195 100 196-215 060 Weight Frequency Intervals 75-95 4 96-115 10 O D. 116-135 20 136-155 20 156-175 22 176-195 8 196-215 2 Weight Frequency Intervals 85-104 4 105-124 10 O E. 125-144 20 145-164 20 165-184 22 185-204 8 205-250 2
Step by Step Solution
There are 3 Steps involved in it

Get step-by-step solutions from verified subject matter experts