

Question: Which graph shows f(x) = 37+4 and the translation g(I) = f(x - 5)? 127 10 8 6 O f() 2 -7 -6-5 -4 -3
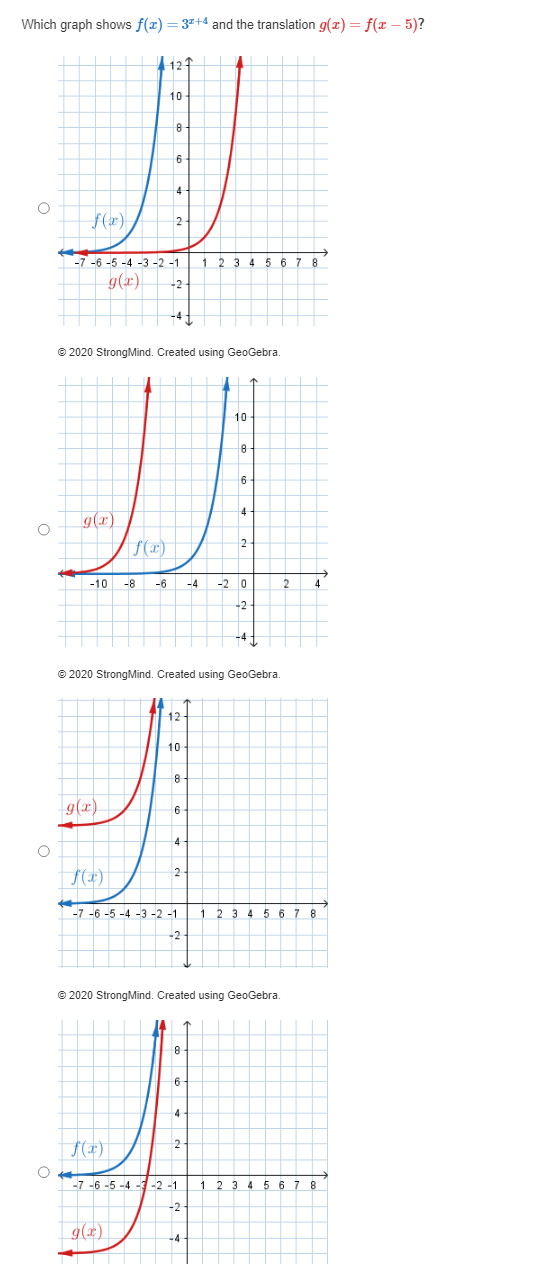
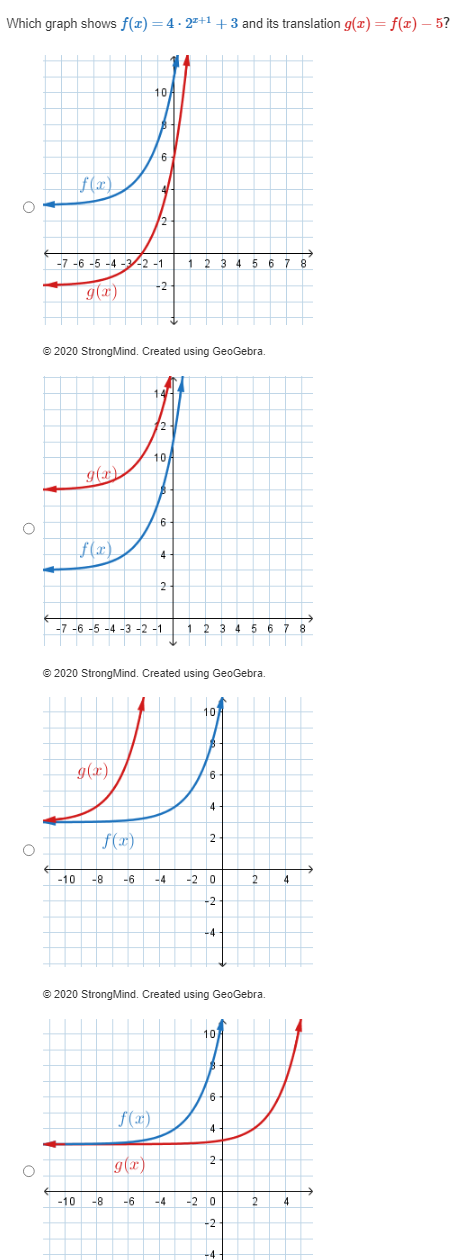
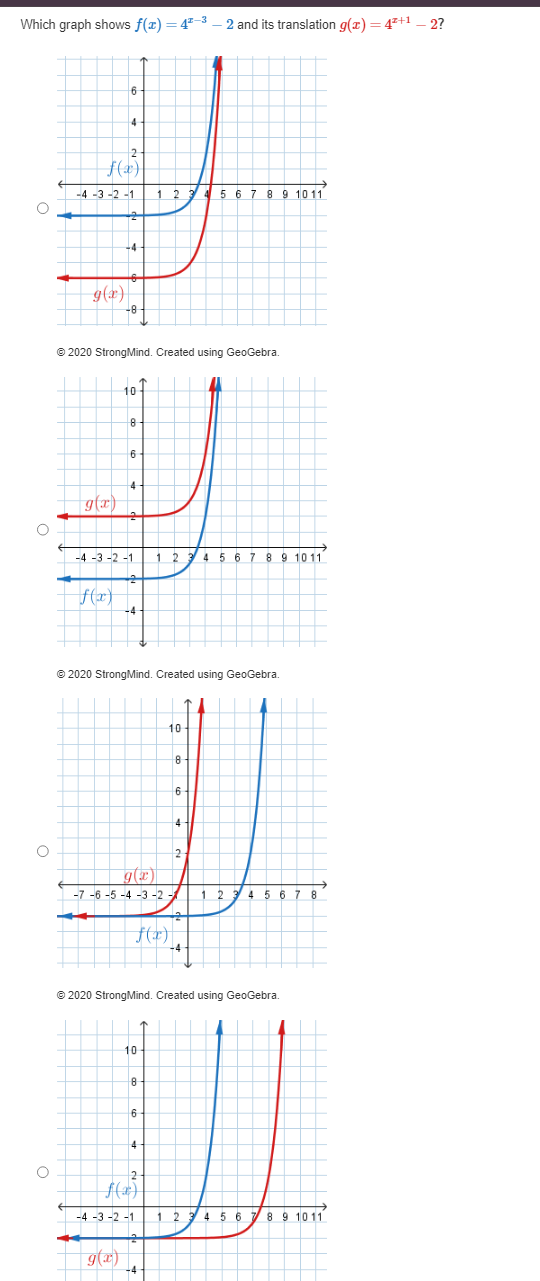
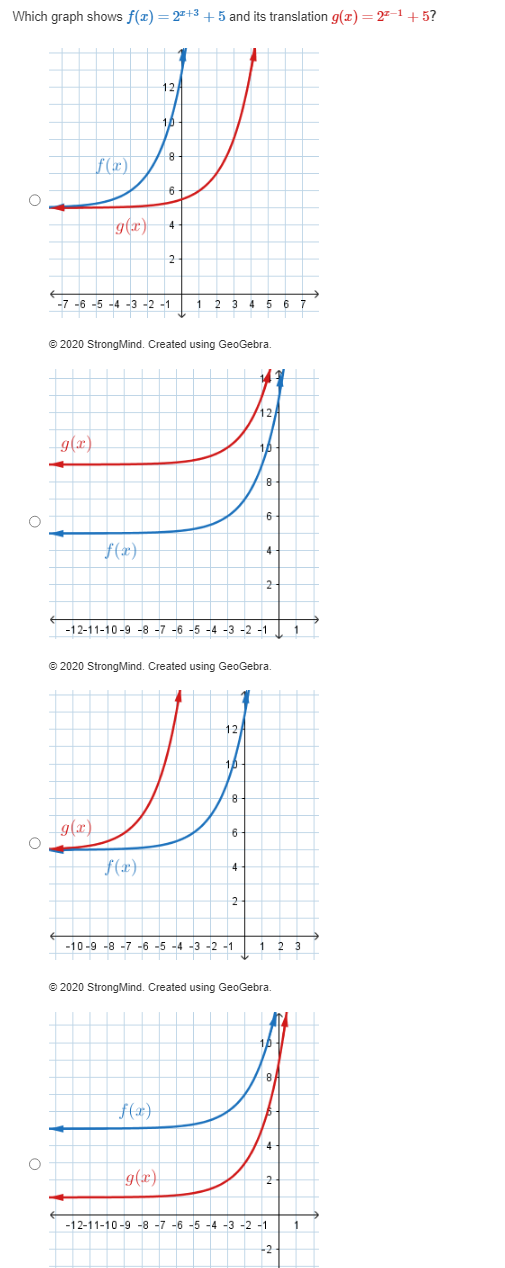
Which graph shows f(x) = 37+4 and the translation g(I) = f(x - 5)? 127 10 8 6 O f() 2 -7 -6-5 -4 -3 -2 -1 1 2 3 4 567 8 g(r) -2 2020 StrongMind. Created using GeoGebra. 10 18- 6 O g(x) f() 2 -10 -8 -6 -4 -2 0 2 -2 @ 2020 StrongMind. Created using GeoGebra. 12 10 8 g(x) 6 4 O -7 -6 -5 -4 -3 -2 -1 1 2 3 4 5 67 8 -2 @ 2020 StrongMind. Created using GeoGebra. 8 6 12 -7 -6 -5 -4 -3-2-1 1 2 3 4 5 6 7 8 -2 g(x) -4Which graph shows f(x) = 4 . 27+1 + 3 and its translation g(I) = f(I) - 5? 10 6 f(x) O 2 -7 -6 -5 -4 -3-2 -1 1 2 3 4 5 6 7 8 -2 2020 StrongMind. Created using GeoGebra. 12 10 O 6 f(x) 4 2 -7 -6 -5 -4 -3 -2 -1 1 2 3 4 5 6 7 8 @ 2020 StrongMind. Created using GeoGebra. 101 g(r) 6 4 O f(x) 2 -10 -8 -6 -4 -2 0 2 -2 -4 @ 2020 StrongMind. Created using GeoGebra. 10 6 2 O -10 - -6 -4 -2 0 2 4 -2Which graph shows f(x) = 47-3 - 2 and its translation g(x) = 47+1 - 2? N -4 -3 -2 -1 1 2 3 5 6 7 8 9 1011 O g(c) @ 2020 StrongMind. Created using GeoGebra. 10 8 6 4 O -4 -3 -2 -1 1 2 3 4 5 6 7 8 9 1011 -2 f(x) @ 2020 StrongMind. Created using GeoGebra. 10 8 6 4 O 2 -7 -6 -5 -4 -3 -2 - 1 2 3 4 5 6 7 8 f() @ 2020 StrongMind. Created using GeoGebra. 10 6 O f(x) -4 -3-2 -1 123 4 5 6 7 8 9 1011 g( ) -4Which graph shows f(I) = 27+3 + 5 and its translation g(I) = 27-1 + 5? 12 10 8 f (x) 6 O g(x) 4 2 -7 -6 -5 -4 -3 -2 1 1 2 3 4 5 6 7 @ 2020 StrongMind. Created using GeoGebra. 12 8 O 6 fe) 2. -12-11-10-9 -8 -7 -6 -5 -4 -3 -2 -1 1 @ 2020 StrongMind. Created using GeoGebra. 12 -8 g(x) O f(x) 2 -10-9 -8 -7 -6 -5 -4 -3 -2 -1 1 2 3 2020 StrongMind. Created using GeoGebra. 8 f(a) O g(x) 2 -12-11-10-9 -8 -7 -6 -5 -4 -3 -2 -1 1 -2
Step by Step Solution
There are 3 Steps involved in it

Get step-by-step solutions from verified subject matter experts