

Question: Which graph would be the best to use to answer the question ofa relationship between net sales and profit for your company over the last


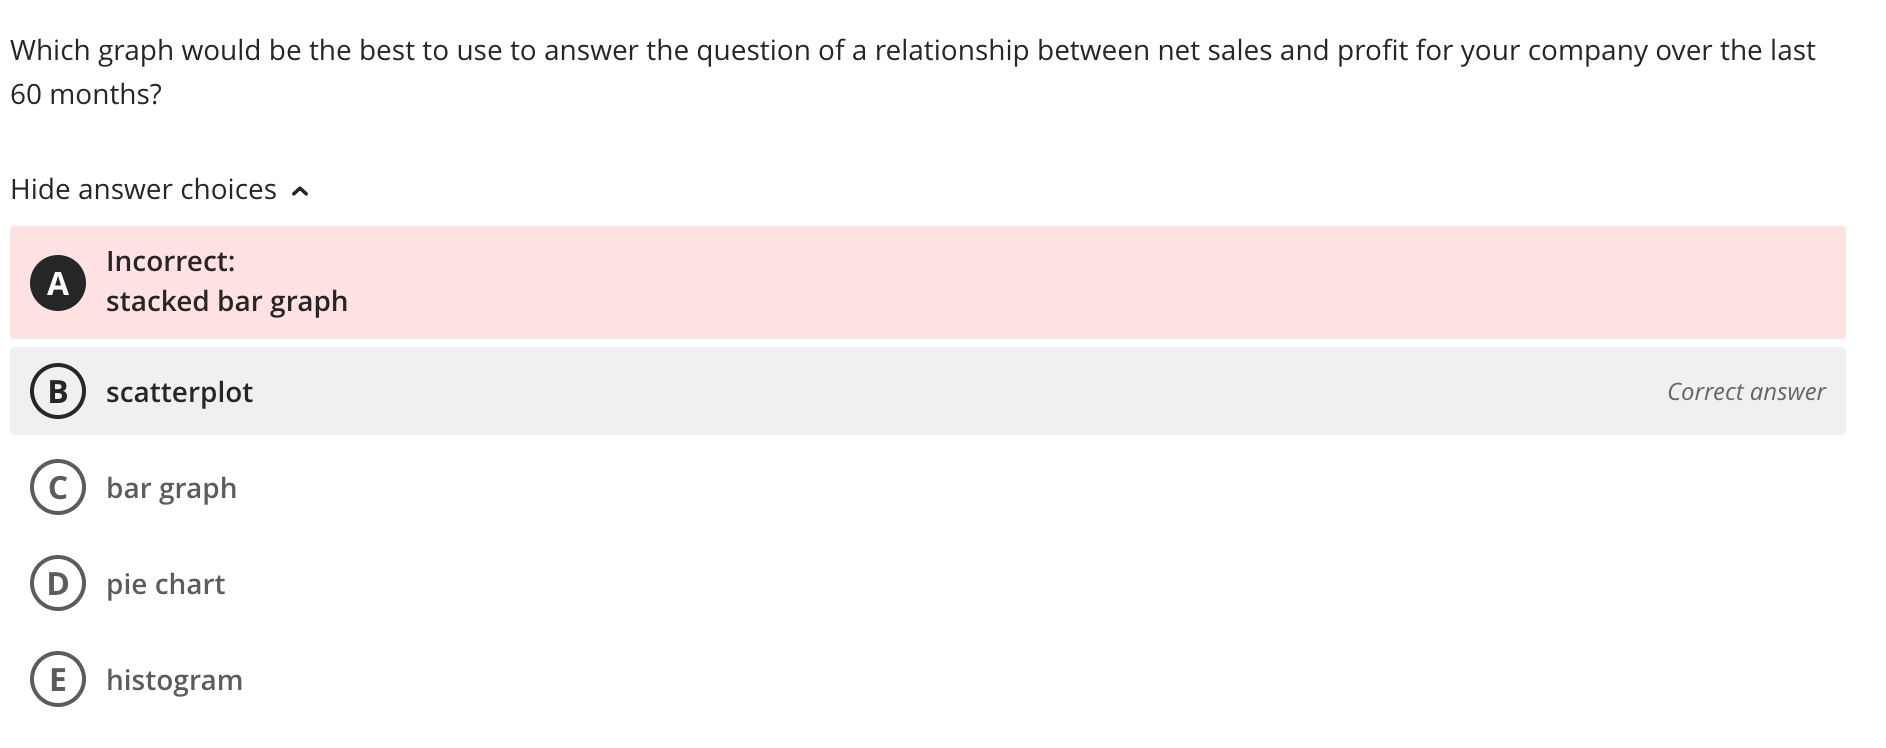
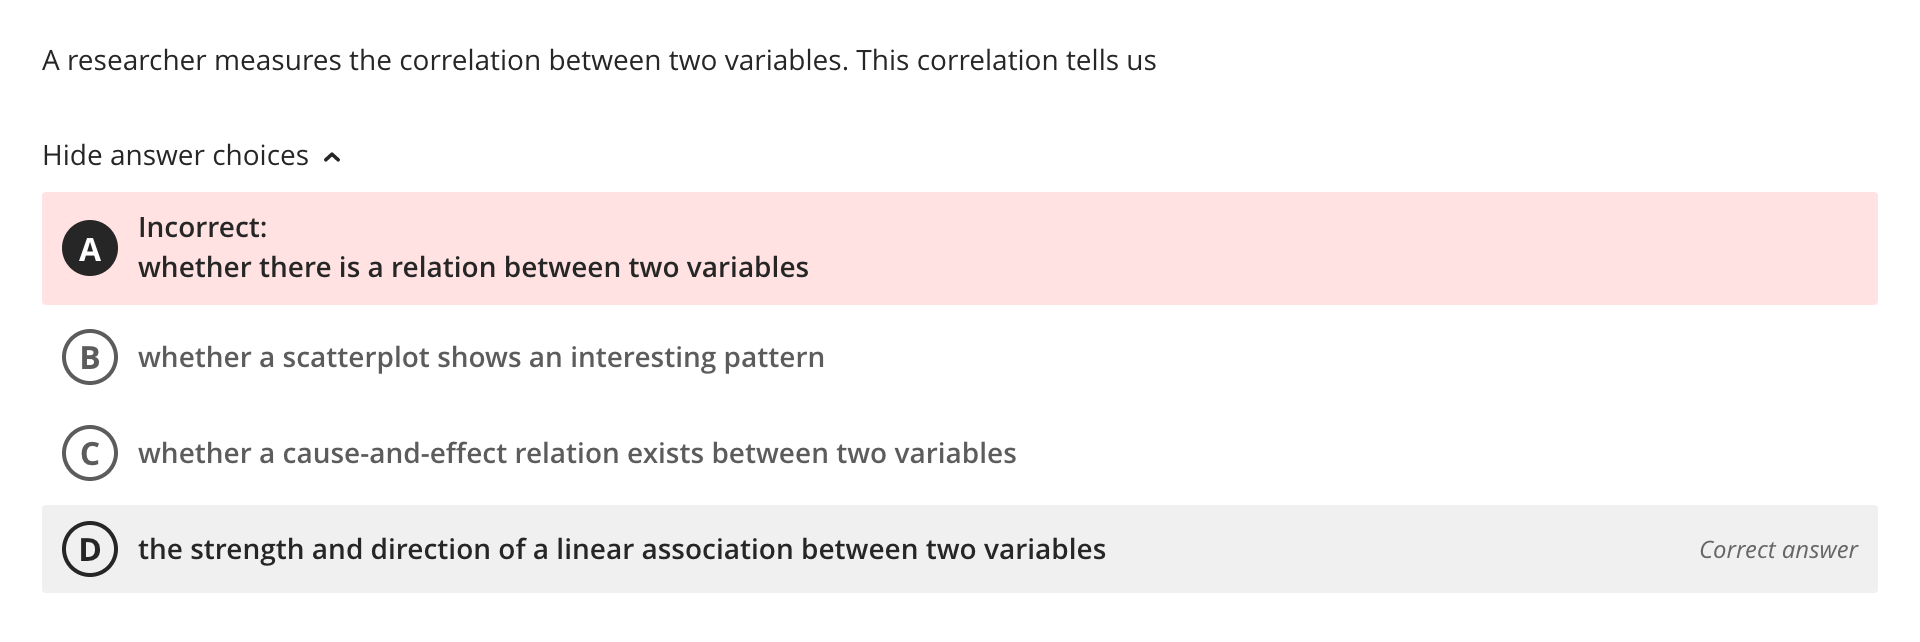
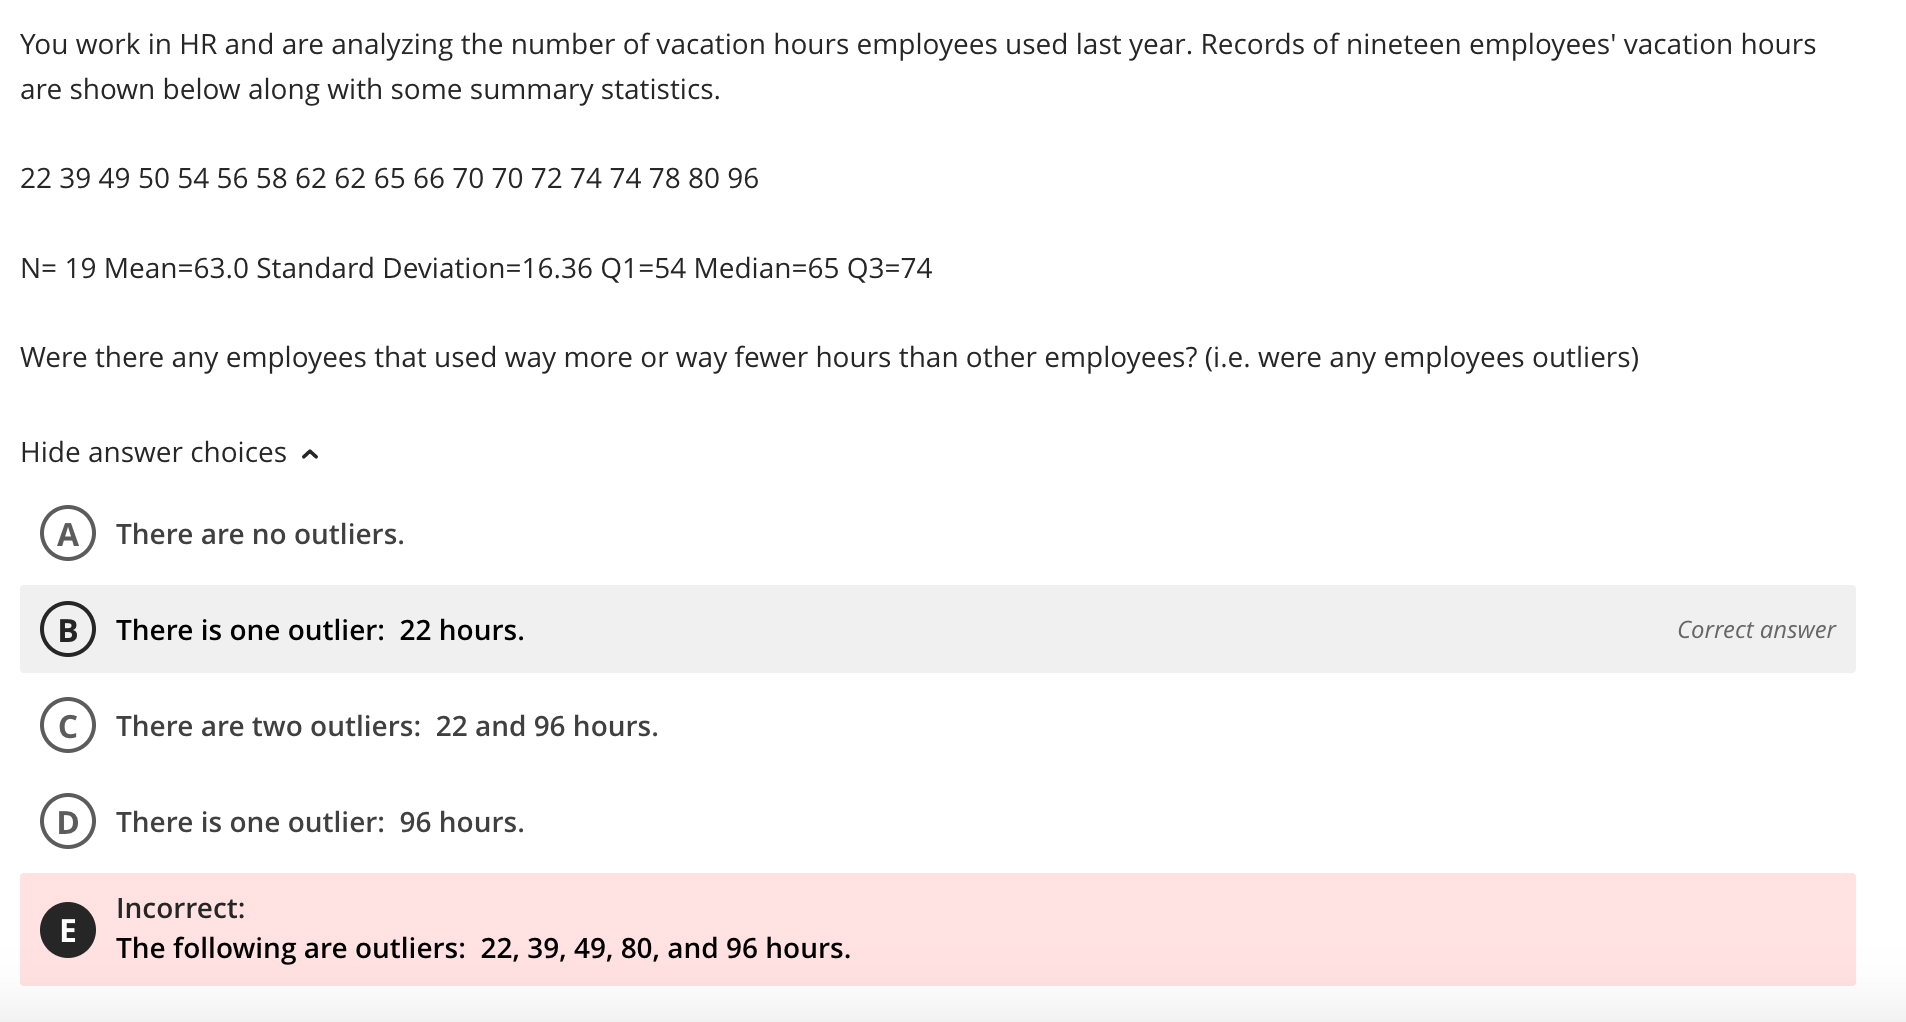
Which graph would be the best to use to answer the question ofa relationship between net sales and profit for your company over the last 60 months? Hide answer choices A Incorrect: stacked bar graph scatterplot Correct answer bar graph pie chart histogram @@O A researcher measures the correlation between two variables. This correlation tells us Hide answer choices A o Incorrect: whether there is a relation between two variables whether a scatterplot shows an interesting pattern whether a ca use-and-effect relation exists between two variables the strength and direction ofa linear association between two variables Correct answer @630 You work in HR and are analyzing the number ofvacation hours employees used last year. Records of nineteen employees' vacation hours are shown below along with some summary statistics. 22 39 49 50 54 56 58 62 62 65 66 70 7O 72 74 74 78 80 96 N: 19 Mean=63.0 Standard Deviation=16.36 Q1 =54 Median=65 Q3=74 Were there any employees that used way more or way fewer hours than other employees? (Le. were any employees outliers) Hide answer choices A Q) There are no outliers. There is one outlier: 22 hours. Correct answer 6:) There are two outliers: 22 and 96 hours. @ There is one outlier: 96 hours. Incorrect: The following are outliers: 22, 39, 49, 80, and 96 hours
Step by Step Solution
There are 3 Steps involved in it

Get step-by-step solutions from verified subject matter experts