

Question: which graphs have linear relationships between independent and dependent variables Partial Regression Plot Dependent Variable: Total score 15.00 10.00 . . . Total score 5.00

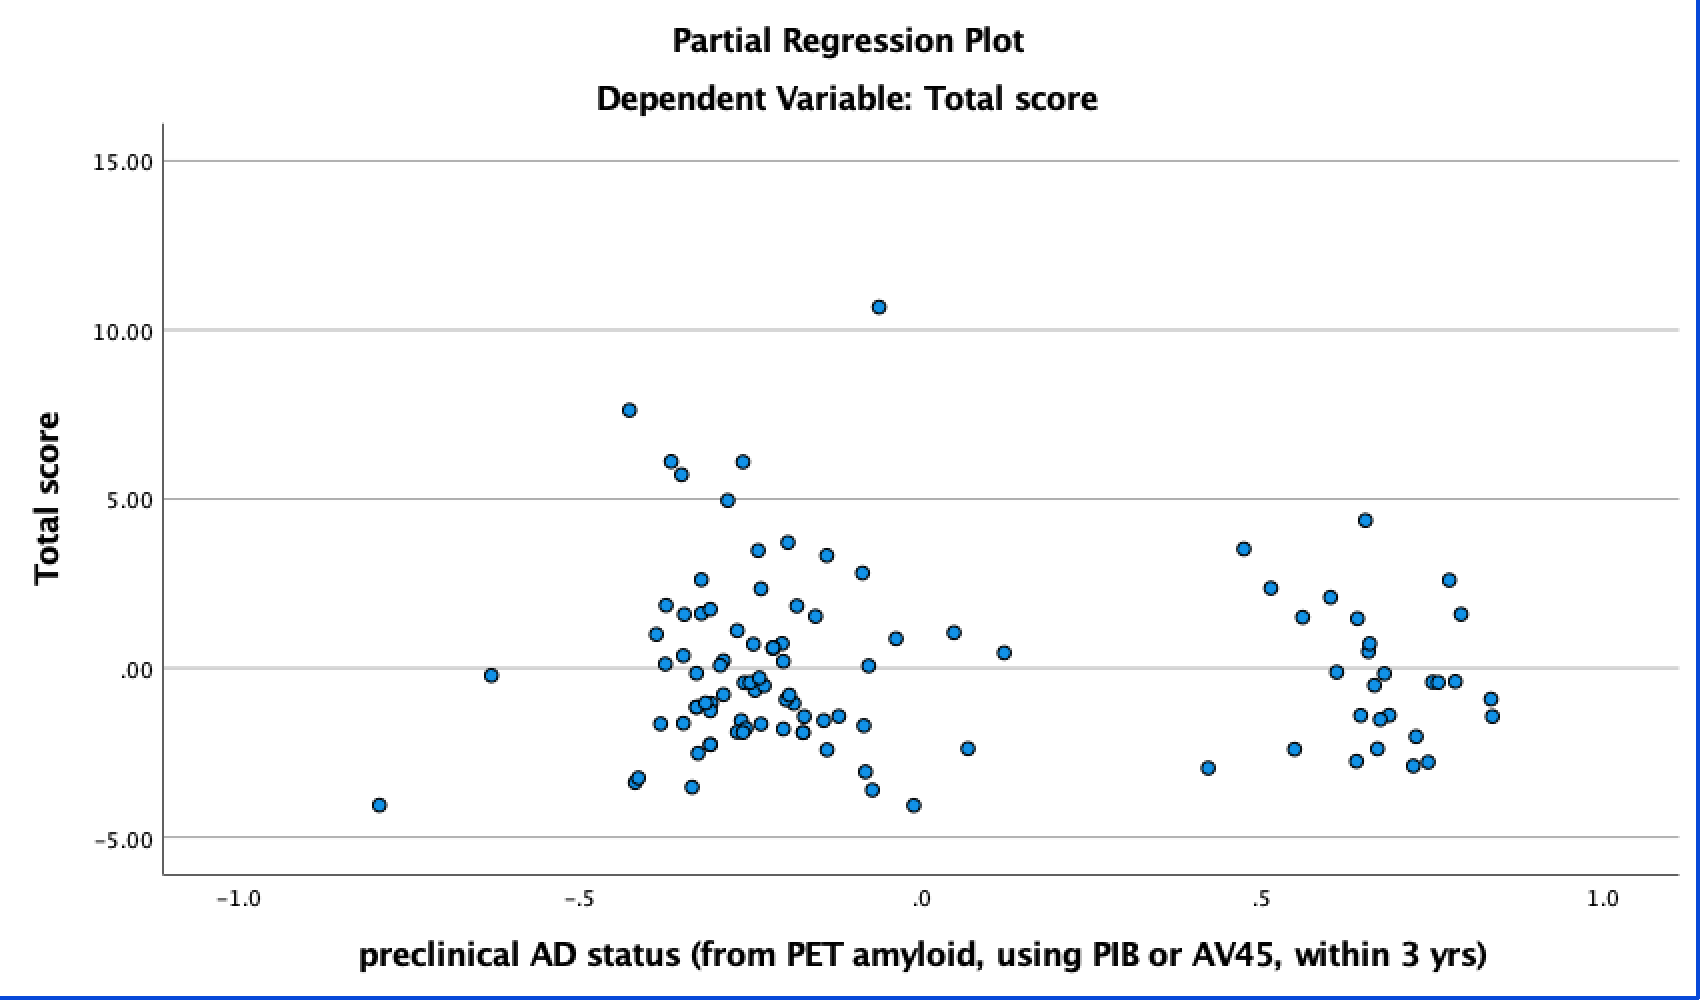
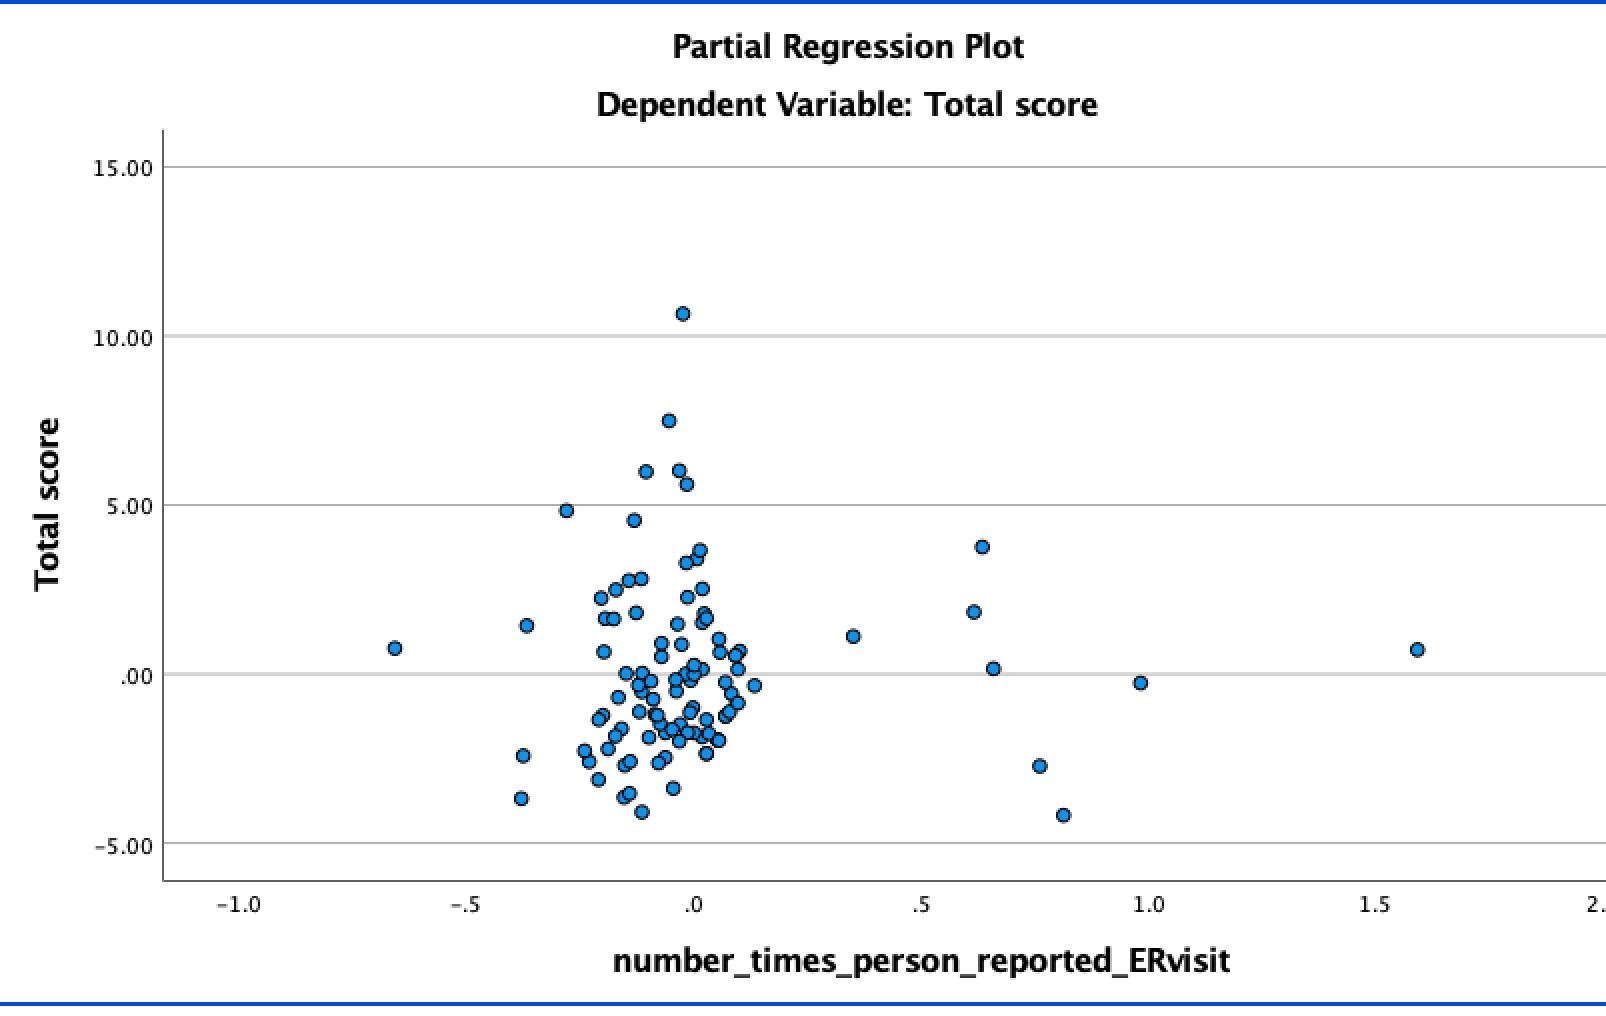
which graphs have linear relationships between independent and dependent variables
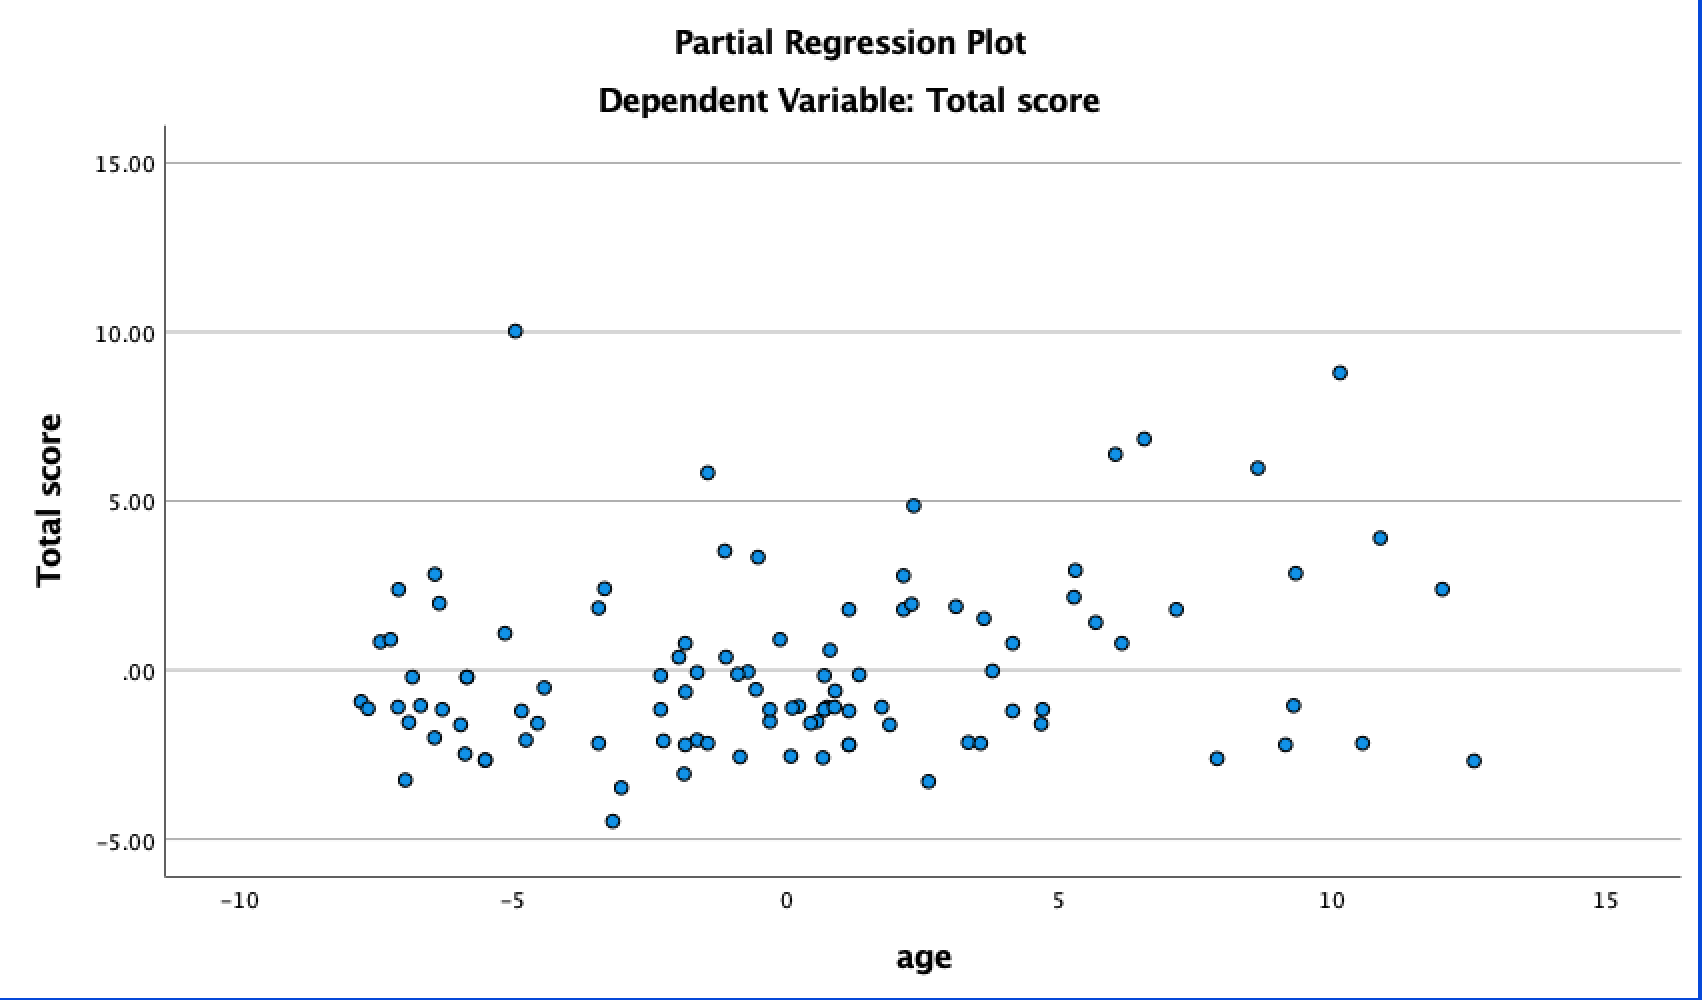


Partial Regression Plot Dependent Variable: Total score 15.00 10.00 . . . Total score 5.00 oo . OC .00 O -5.00 -10 -5 0 5 10 15 agePartial Regression Plot Dependent Variable: Total score 15.00 10.00 Total score 5.00 00 OO -5.00 -1.0 -.5 .0 .5 1.0 preclinical AD status (from PET amyloid, using PIB or AV45, within 3 yrs)Partial Regression Plot Dependent Variable: Total score 15.00 10.00 Total score 5.00 . . O .00 . O O -5.00 -1.0 -.5 0 .5 1.0 1.5 2. number_times_person_reported_ERvisit
Step by Step Solution
There are 3 Steps involved in it
1 Expert Approved Answer
Step: 1 Unlock

Question Has Been Solved by an Expert!
Get step-by-step solutions from verified subject matter experts
Step: 2 Unlock
Step: 3 Unlock