

Question: Which graphs have linear relationships between independent and dependent variables fPartial Regression Plot Dependent Variable: Total score 15.00 10.00 . 5.00 Total score . O

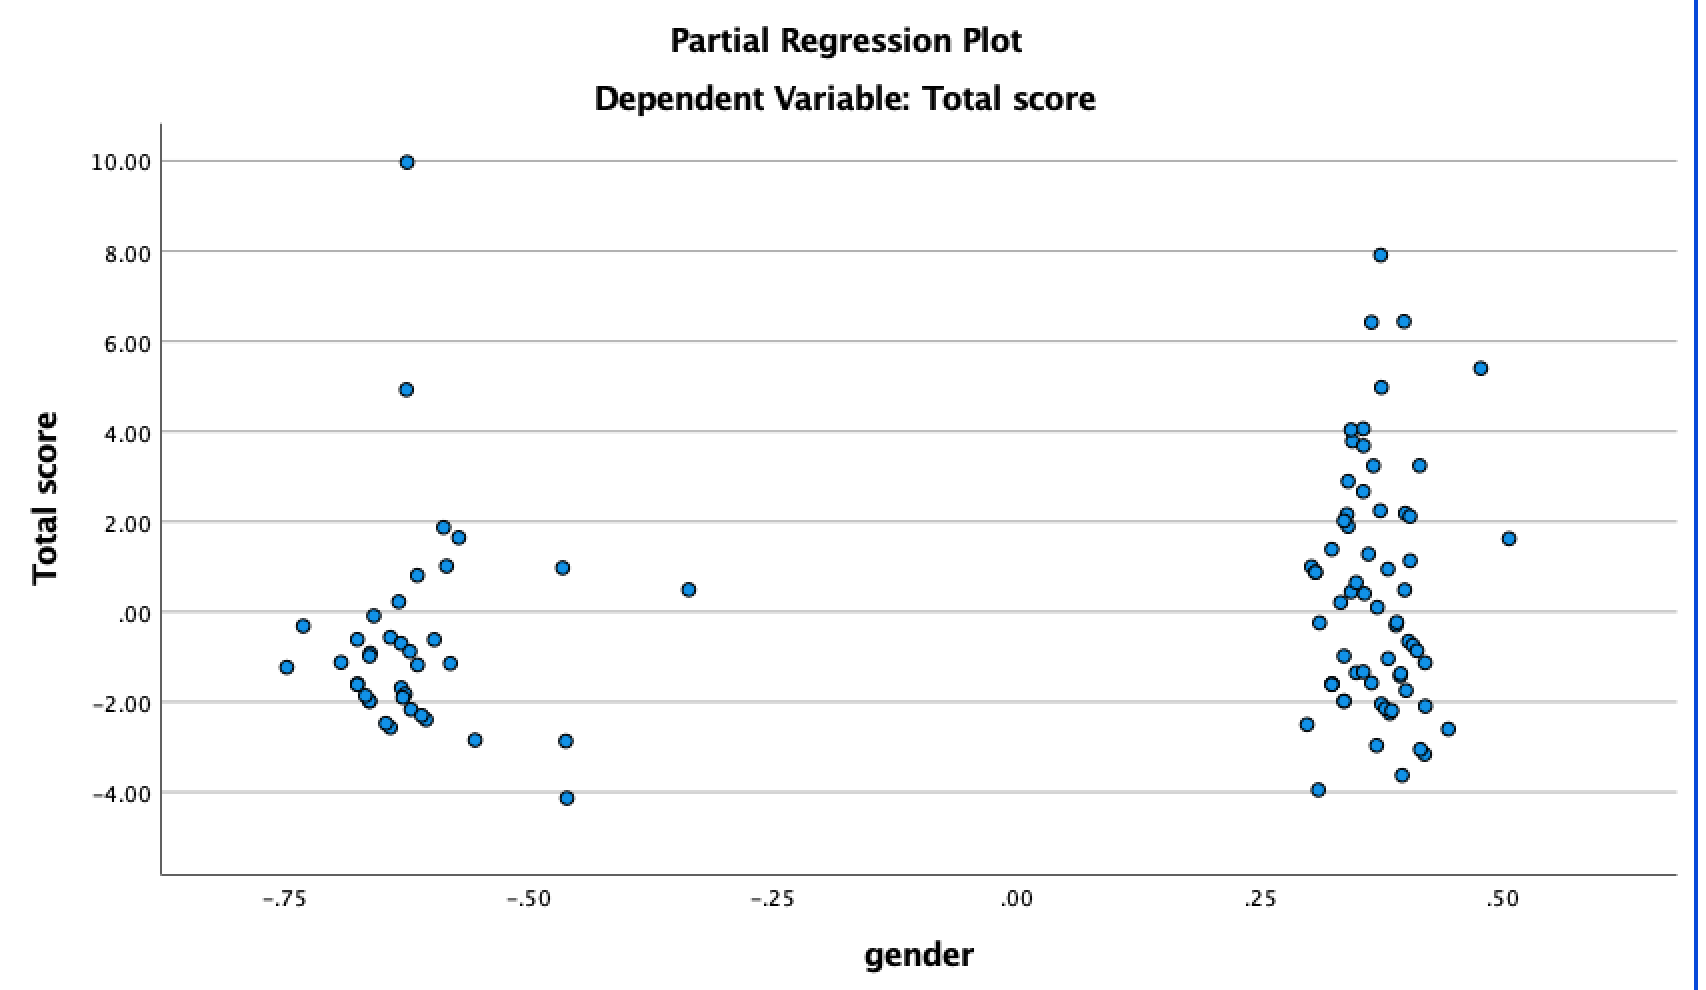

Which graphs have linear relationships between independent and dependent variables

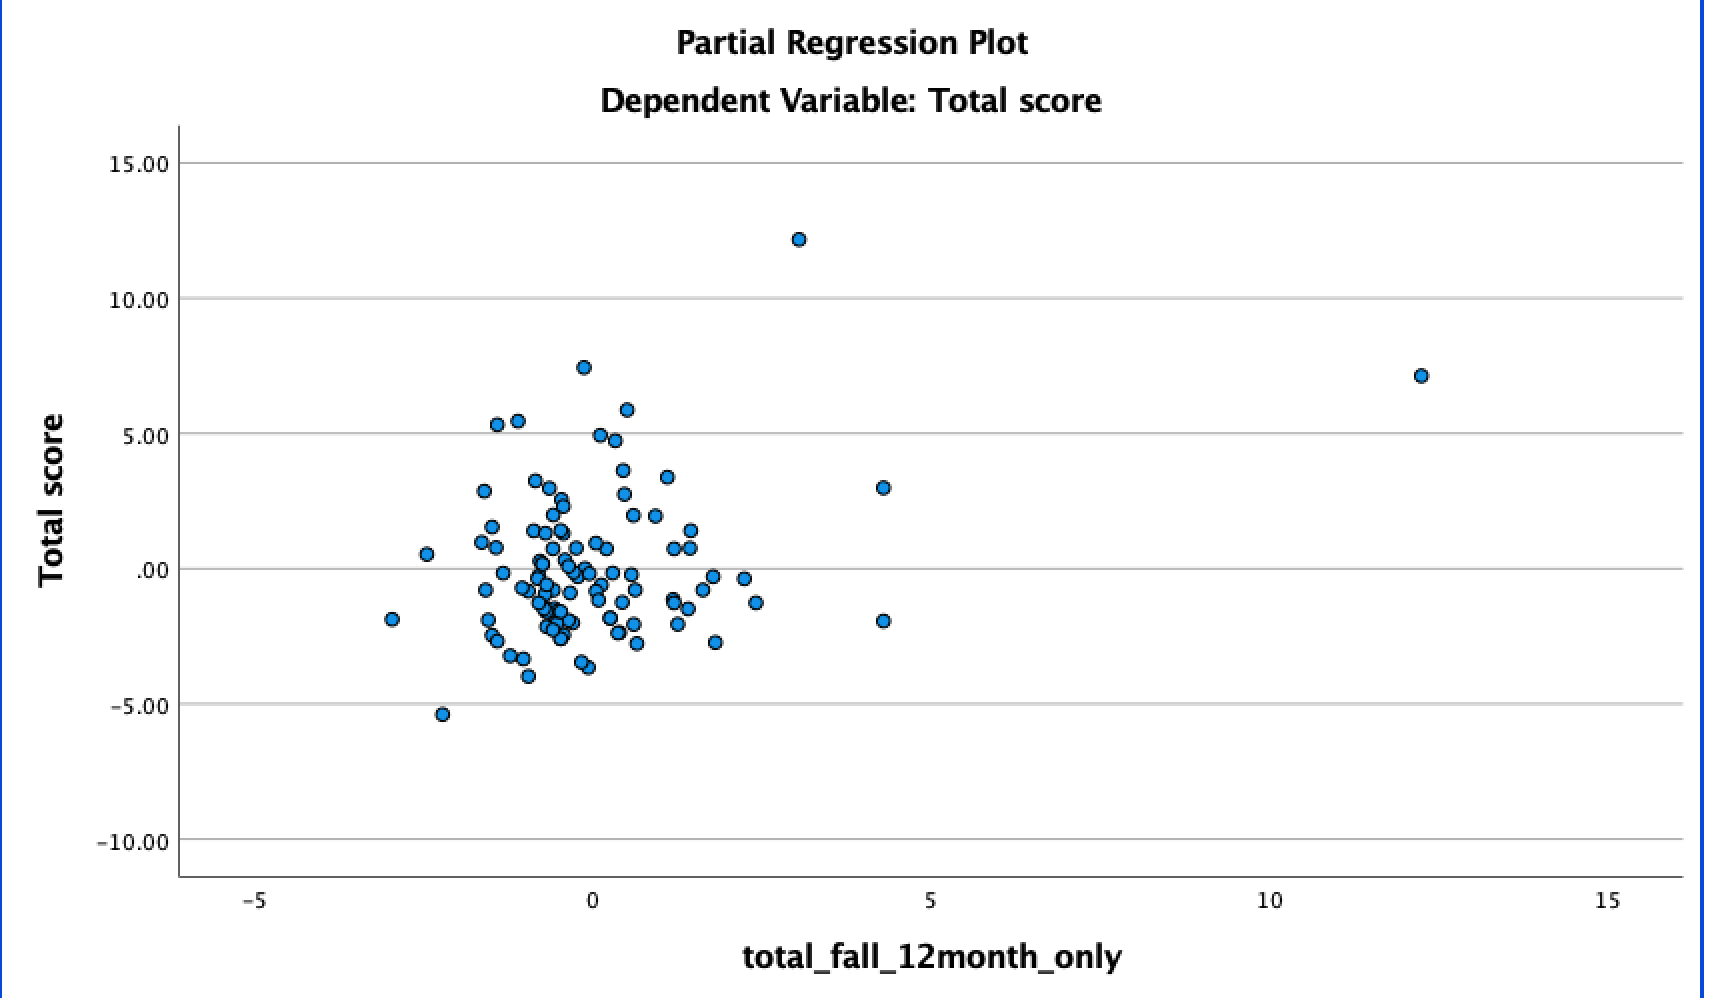

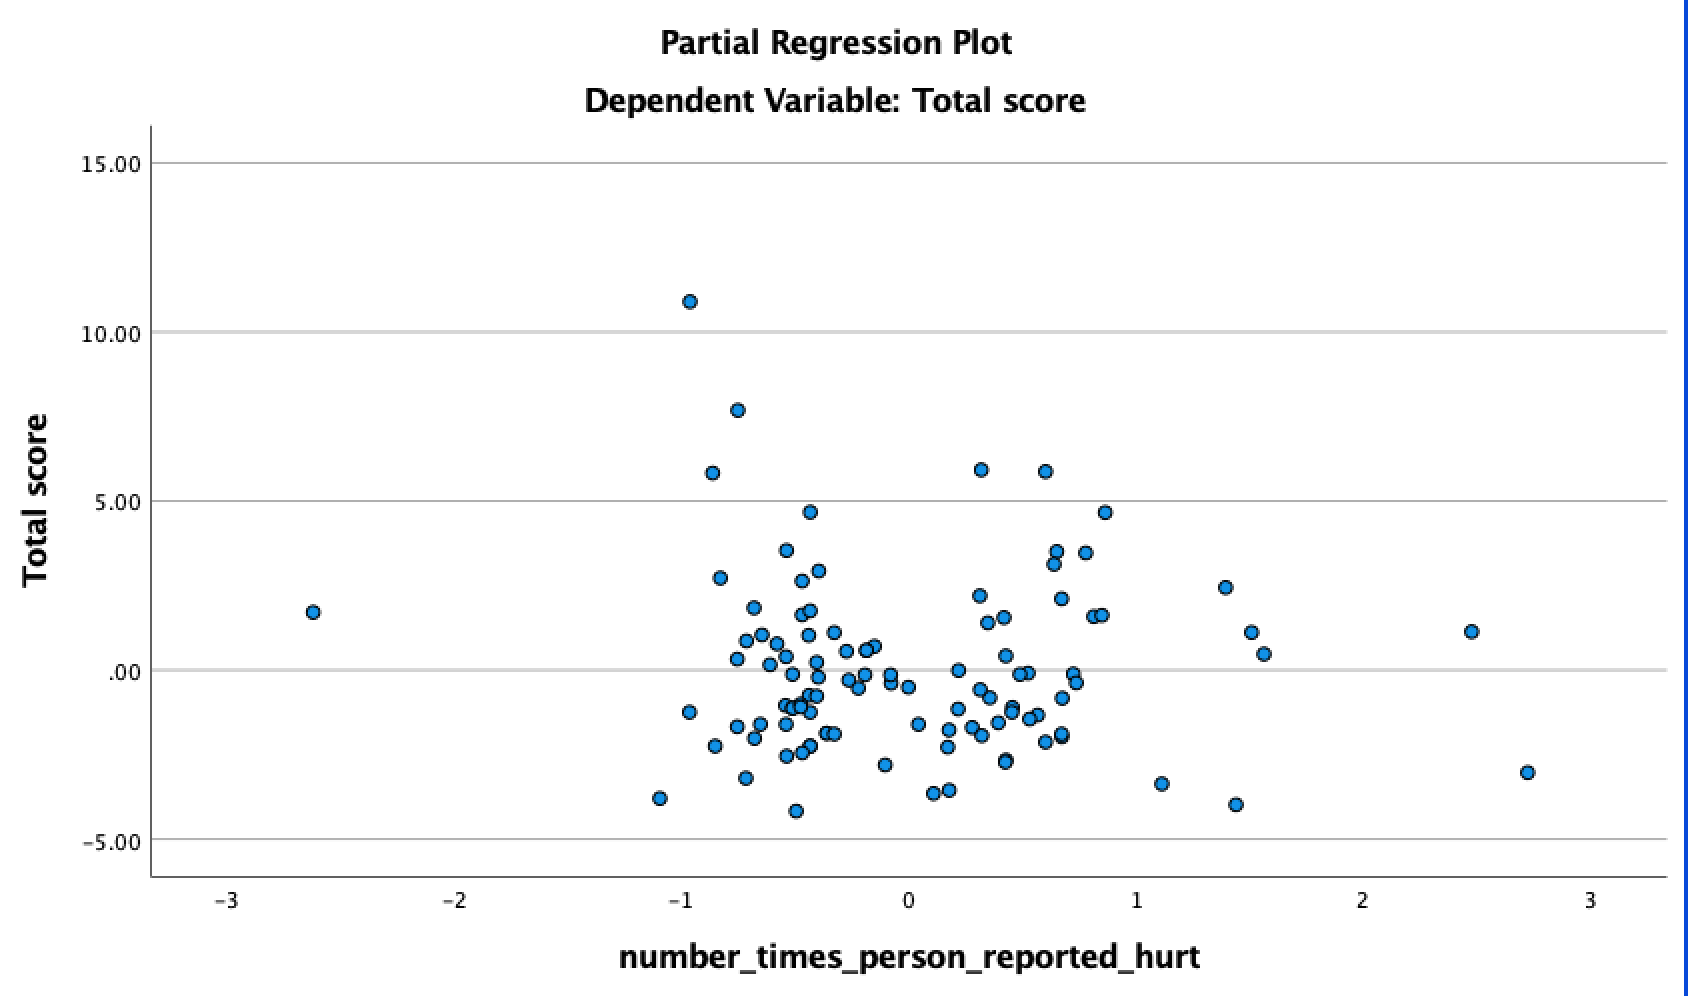
\fPartial Regression Plot Dependent Variable: Total score 15.00 10.00 . 5.00 Total score . O .00 -5.00 -10.00 -5 0 5 10 15 total_fall_12month_onlyPartial Regression Plot Dependent Variable: Total score 10.00 8.00 6.00 . 4.00 Total score 2.00 O .00 -2.00 -4.00 -.75 -.50 -.25 00 .25 .50 genderPartial Regression Plot Dependent Variable: Total score 15.00 10.00 O Total score 5.00 O O OO .00 CL -5.00 -3 -2 -1 0 1 2 number_times_person_reported_hurt
Step by Step Solution
There are 3 Steps involved in it
1 Expert Approved Answer
Step: 1 Unlock

Question Has Been Solved by an Expert!
Get step-by-step solutions from verified subject matter experts
Step: 2 Unlock
Step: 3 Unlock