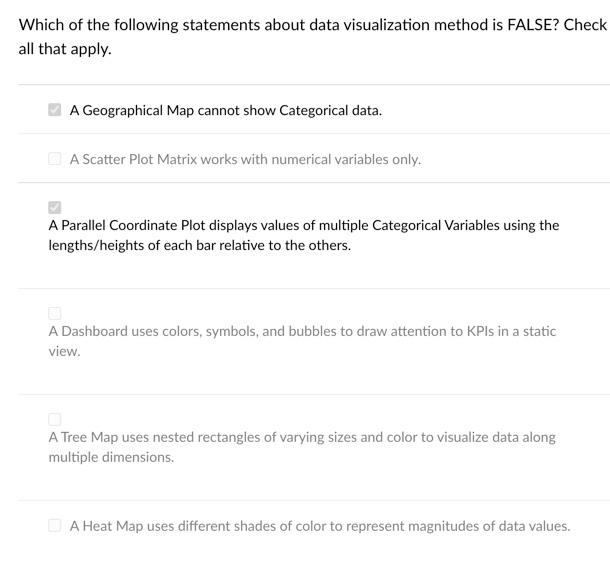
Question: which is correct? these choices may not be correct Which of the following statements about data visualization method is FALSE? Check all that apply. A

which is correct? these choices may not be correct

which is correct? these choices may not be

Which of the following statements about data visualization method is FALSE? Check all that apply. A Geographical Map cannot show Categorical data. A Scatter Plot Matrix works with numerical variables only. A Parallel Coordinate Plot displays values of multiple Categorical Variables using the lengths/heights of each bar relative to the others. A Dashboard uses colors, symbols, and bubbles to draw attention to KPIs in a static view. A Tree Map uses nested rectangles of varying sizes and color to visualize data along multiple dimensions. A Heat Map uses different shades of color to represent magnitudes of data values

Step by Step Solution

There are 3 Steps involved in it

1 Expert Approved Answer
Step: 1 Unlock blur-text-image
Question Has Been Solved by an Expert!

Get step-by-step solutions from verified subject matter experts

Step: 2 Unlock
Step: 3 Unlock

Students Have Also Explored These Related General Management Questions!