

Question: Which of the following statements about data visualization method is FALSE? Check all that apply. A Geographical Map cannot show Categorical data. A Tree Map
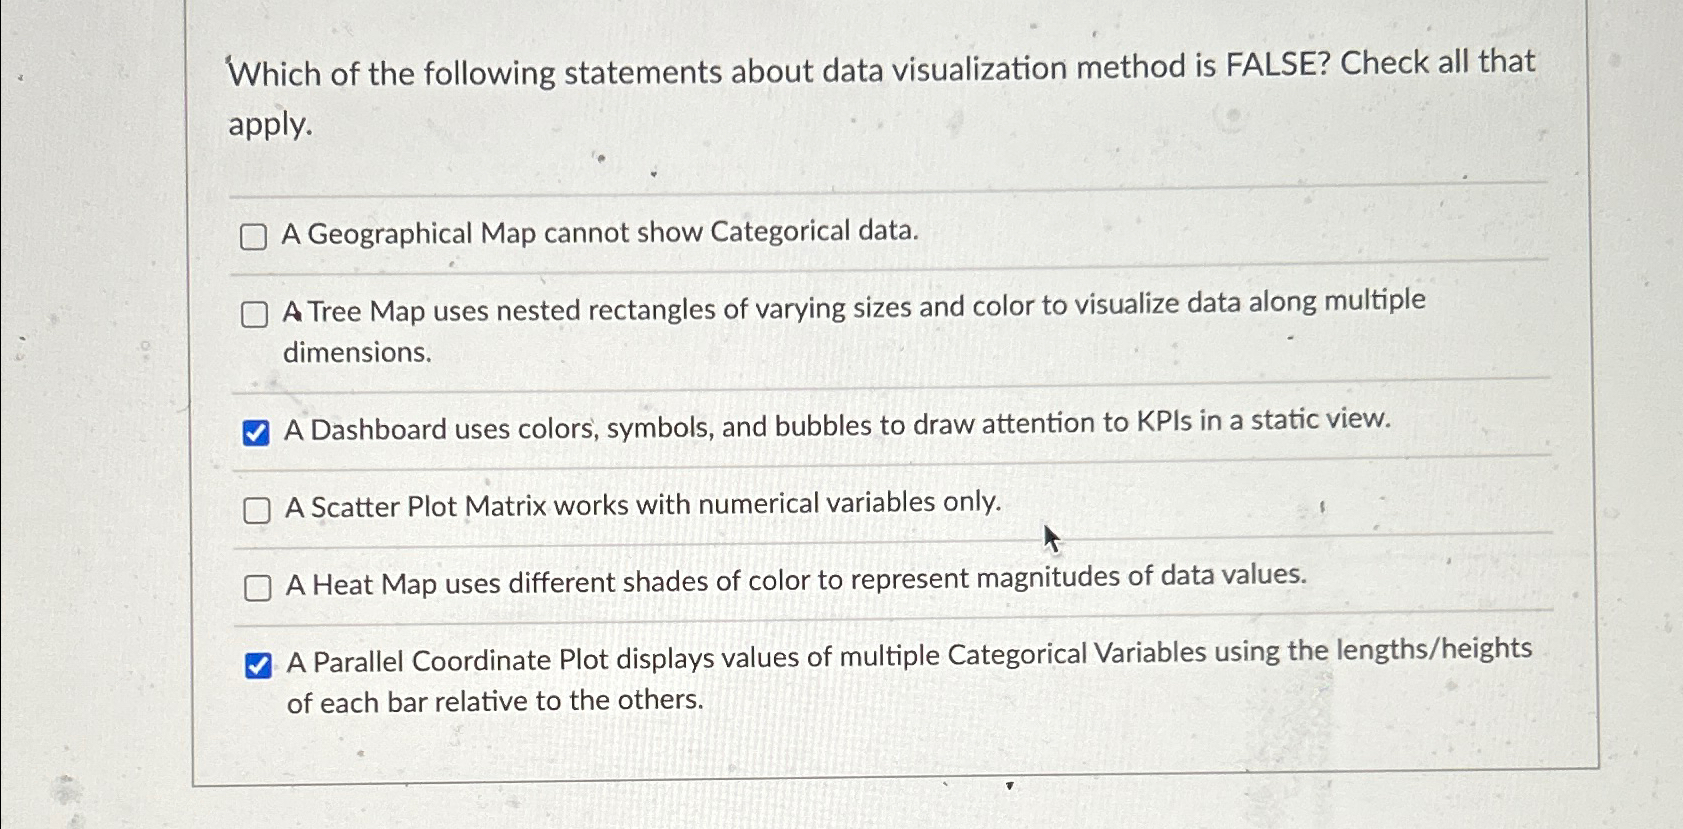
Which of the following statements about data visualization method is FALSE? Check all that apply.
A Geographical Map cannot show Categorical data.
A Tree Map uses nested rectangles of varying sizes and color to visualize data along multiple dimensions.
A Dashboard uses colors, symbols, and bubbles to draw attention to KPIs in a static view.
A Scatter Plot Matrix works with numerical variables only.
A Heat Map uses different shades of color to represent magnitudes of data values.
A Parallel Coordinate Plot displays values of multiple Categorical Variables using the lengthsheights of each bar relative to the others.
Step by Step Solution
There are 3 Steps involved in it
1 Expert Approved Answer
Step: 1 Unlock

Question Has Been Solved by an Expert!
Get step-by-step solutions from verified subject matter experts
Step: 2 Unlock
Step: 3 Unlock