

Question: which is the correct graph for this equation ? thanks ( > 5 methlrl.com C it D1 Applied Managerial Statistics (100] Homework: Week 2 Homework
which is the correct graph for this equation ? thanks
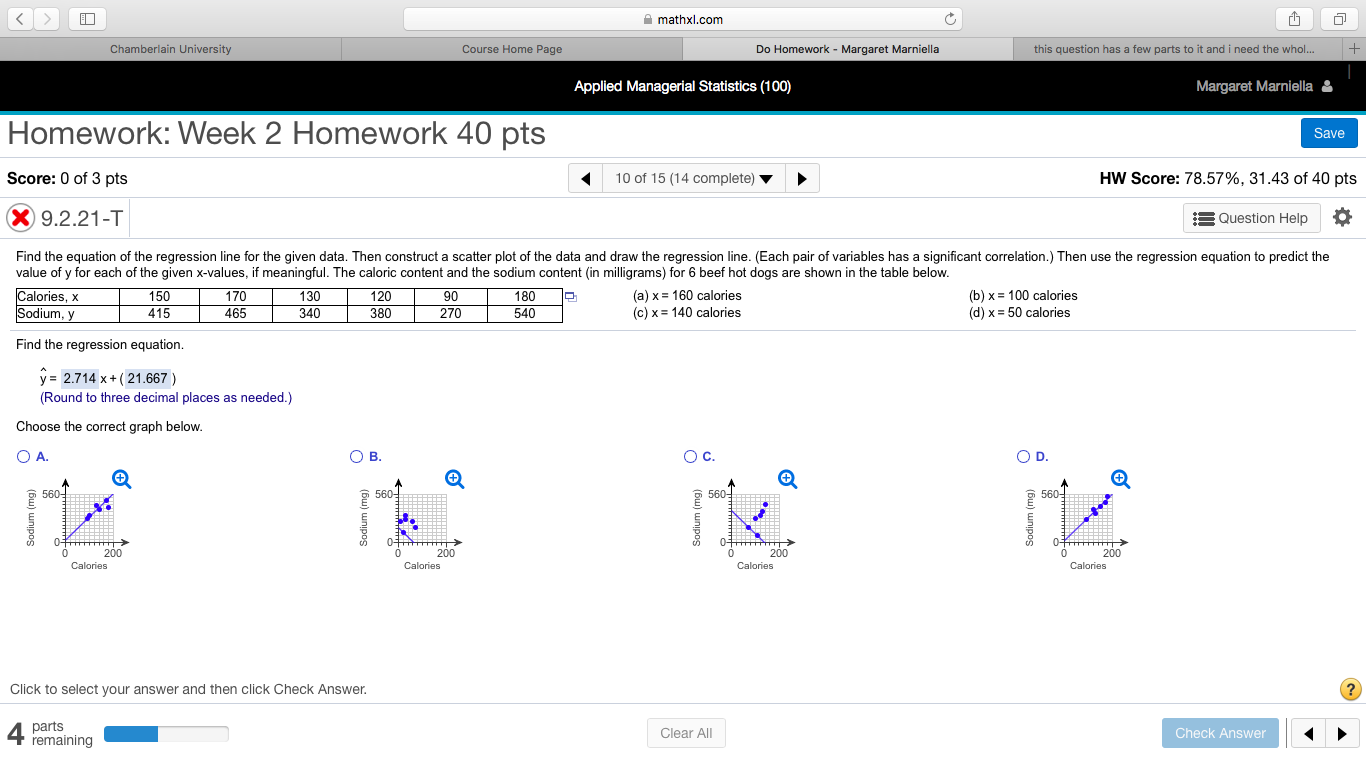
( > 5 methlrl.com C it D1 Applied Managerial Statistics (100] Homework: Week 2 Homework 40 pts Score: 0 of 3 pie 4 to 0115 (14 complete) 7 ) HW Score: 78.57%. 31.43 of 40 pts 9.2.21-T 55 Questlun Help 0 Find the equation of the rel-ressin line for the given data. Then construct a scatter plot of the data and draw the regression line. (anh pair ofvariabies has a signicant correlation.) Then use the regression equation to predict the value oi'y toreaoh of the given xvalues, il meaningful. The caloric content and the sodium content [in milligrams) for 6 beef hot dogs are shown in the table below. Calories. x 150 170 130 12!] 90 180 Q (a) x= 160 calories (tax: 100 calories Sodium. 54 415 465 34E] 38E] 270 540 (c) x =14!) calories (d) x = 50 calories Find the regression equation. = 2.714x+ r 21.667) (Round to three decimal plaoes as needed.) Choose the correct graph below. 0 A. O a O F" O l: 9 a ' a 61 Sodium {mg} Sudiim [moi Sudlum {mg} 'o. Sdlum {mg} Celonee Calnnaa Ezalnnaa Calnnaa Cllck to select your answer and then click Check Answer \"a\" - remainlng Clear All
Step by Step Solution
There are 3 Steps involved in it

Get step-by-step solutions from verified subject matter experts