

Question: Which method does Target use to report net cash flows from operating activities? How can you tell? Target earned net income during fiscal year 2019.
- Which method does Target use to report net cash flows from operating activities? How can you tell?
- Target earned net income during fiscal year 2019. Did operations provide cash or use cash during 2019? Give the amount. How did net cash provided by (used for) operations during 2019 compare with net income in 2019?
- For the year ended February 1, 2020 (fiscal year 2019), did Target pay cash dividends? If so, how much?
- For the year ended February 1, 2020, did Target use cash to purchase property, plant, and equipment? If so, how much?
-
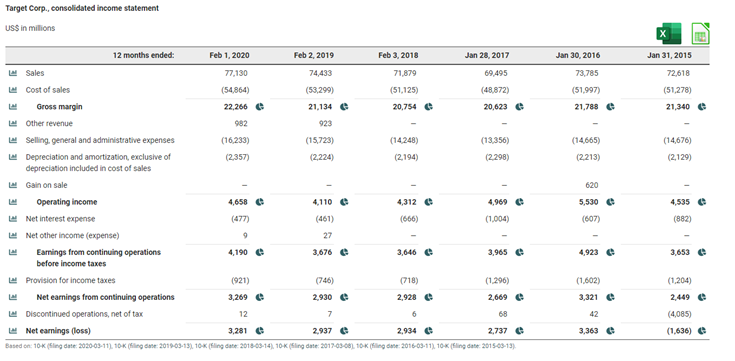
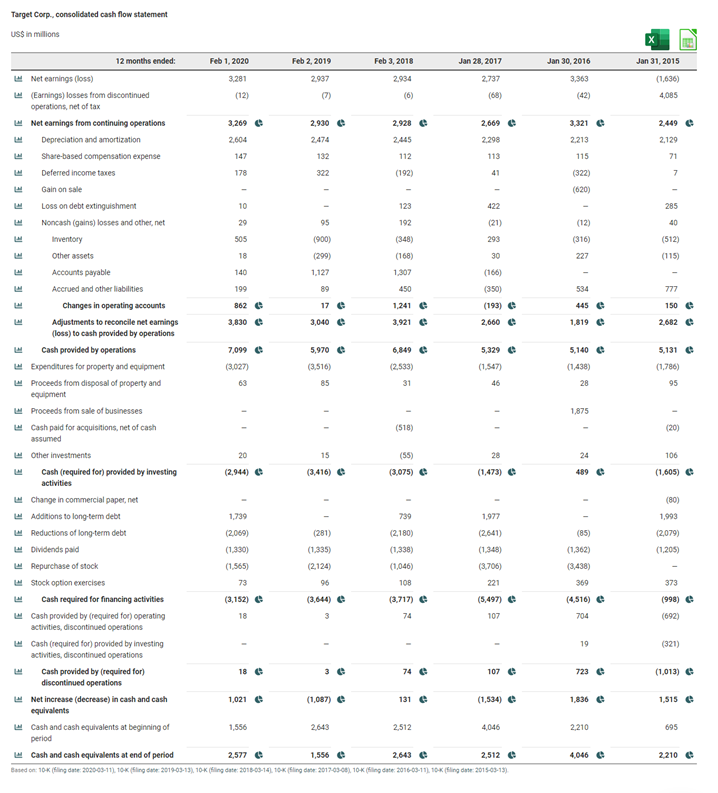
Target Corp., consolidated Income statement US$ in millions Jan 30, 2016 73,785 (51,997) Jan 31, 2015 72,618 (51,278) 21,340 e 21.788 (14,676) (14.665) (2213) (2,129) 620 12 months ended: Feb 1, 2020 Feb 2, 2019 Feb 3, 2018 Jan 28, 2017 Sales 77,130 74,433 71,879 69,495 Cost of sales (54,864) (53,299) (51.125) (48,872) Gross margin 22,266 21.134 e 20,754 20,623 Other revenue 982 923 Selling general and administrative expenses (16.233) (15723) (14248) (13,356) Depreciation and amortization, exclusive of (2,357) (2,224) (2.194) (2.298) depreciation included in cost of sales Gain on sale Operating Income 4,658 4,110 4,312 4,969 Net interest expense (461) (666) (1.004) Net other income (expense) 9 27 Earnings from continuing operations 4,190 3,676 3,646 3,965 e before income taxes Provision for income taxes (921) (746) (718) (1.296) Net earnings from continuing operations 3,269 2.930 2,928 2,669 Discontinued operations, net of tax 12 7 6 68 Net earnings (loss) 3,281 2.937 2,934 2,737 0 Based on: 10K (Sling date: 2020-03-11). 10K (ling date: 2017-03-13.10 (ling date: 2018-05-14) 10K (Sling date: 2017-03-08.10 (ling date: 2016-03-11) 10K (ling date: 2015-05-13) 5,530 (607) 4,535 (882) 4,923 3,653 (1.602) 3,321 42 (1.204) 2.449 e (4,085) (1.636) 3,363 Target Corp., consolidated statement of comprehensive income US$ in millions Jan 30, 2016 Jan 31, 2015 3.363 (1,636) (139) (65) (27) 6 4 (3) 431 12 months ended Feb 1, 2020 Feb 2, 2019 Feb 3, 2018 Jan 28, 2017 Net earnings (loss) 3.281 2.937 2.934 2737 Pension and other benefit liabilities, net of (52) 2 (13) tax Currency translation adjustment and cash 2 (6) flow hedges, net of tax Other comprehensive income (loss). (63) (58) (9) e net of tax Comprehensive income (loss) 3.218 2,879 2,942 2,728 e Based on: 10k filing date: 2020-03-11.10 (ling date: 2019-03-13.10 (ling date: 2018-03-14 10K (ling date: 2017-03-05) 10K (ling date: 2016-03-11), 10 filing date: 2015-03-13) (30) 292 e 3,333 e (1,344) Target Corp.. consolidated cash flow statement US$ in millions Jan 30, 2016 Jan 31, 2015 (1.636) 3,363 4,085 3,321 2.449 2.213 2,129 113 71 115 (322) (620) 7 285 (12) 40 (512) (316) 227 (115) 777 534 445 150 1,819 e 2,682 5,140 e (1438) 5,131 (1.786) 28 95 1,875 12 months ended: Feb 1, 2020 Feb 2, 2019 Feb 3, 2018 Jan 28, 2017 Net earnings doss) 3.281 2.937 2.934 2.737 (Earnings) losses from discontinued (12) (7) (6) (68) operations, net of tax Net earnings from continuing operations 3,269 2,930 2,928 2,669 0 Depreciation and amortization 2,604 2474 2.445 2.298 Share-based compensation expense 147 132 112 Deferred income taxes 178 322 (192) Gain on sale Loss on debt extinguishment 10 123 422 Noncash (gains) losses and other net 29 95 192 (21) Inventory 505 (900) (348) 293 Other assets 18 (299) (168) 30 Accounts payable 140 1.127 1,307 (166) Accrued and other liabilities 199 89 450 (350) Changes in operating accounts 862 e 17 1,241 e (193) Adjustments to reconcile net earnings 3,830 3,040 3,921 2,660 (loss) to cash provided by operations Cash provided by operations 7,099 5,970 6,849 5,329 Expenditures for property and equipment (3.027) (3.516) (2,533) Proceeds from disposal of property and 63 85 31 46 equipment Proceeds from sale of businesses Cash paid for acquisitions, net of cash (518) assumed Other investments 20 15 (55) 28 Cash (required for) provided by investing (2.944) (3,416) (3,075) (1,473) activities Change in commercial paper, niet Additions to long-term debt 1,739 739 1,977 w Reductions of long-term debt (2.069) (281) (2,180) (2641) Dividends pald (1.330) (1.335) (1.338 Repurchase of stock (1,565) (2,124) (1,046) (3.706) Stock option exercises 73 96 108 221 Cash required for financing activities (3,152) e (3.644) (3.717) e (5,497) e Cash provided by (required for) operating 18 3 74 activities, discontinued operations Cash (required for) provided by investing activities, discontinued operations Cash provided by (required for) 18 3 e 74 e 107 discontinued operations Net increase (decrease) in cash and cash 1,021 (1,087) 131 (1,534) e equivalents Cash and cash equivalents at beginning of 1,556 2643 2,512 4,046 period Cash and cash equivalents at end of period 2,577 0 1,556 2,643 0 2,512 Based on: 10k (iling date: 2020-05-11 10K (Sling date 2019-03-13) 10K (ling Cute 2016-05-14.10 Sling 2017-03-06) 10K (note: 2016-03-11, 10 filing date 2015-05-13) (20) 24 106 489 (1,605) (80) 1,993 (85) (2,079) (1205) (1,362) (3,438) 369 (4.516) 373 (998) e (692) 107 704 19 (321) 723 (1.013) e 1,836 1,515 0 2,210 695 4,046 2.210
Step by Step Solution
There are 3 Steps involved in it

Get step-by-step solutions from verified subject matter experts