

Question: Which of the following plots represents an ideal binary mixture? (a) Plot of P total (b) Plot of P, (c) Plot of total 1
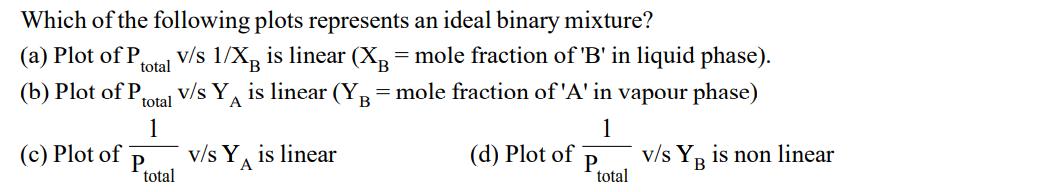
Which of the following plots represents an ideal binary mixture? (a) Plot of P total (b) Plot of P, (c) Plot of total 1 P v/s 1/XB is linear (XB = mole fraction of 'B' in liquid phase). v/s Y is linear (YB = mole fraction of 'A' in vapour phase) A 1 total v/s Y is linear A (d) Plot of P total v/s YB is non linear
Step by Step Solution
★★★★★
3.39 Rating (155 Votes )
There are 3 Steps involved in it
1 Expert Approved Answer
Step: 1 Unlock

Question Has Been Solved by an Expert!
Get step-by-step solutions from verified subject matter experts
Step: 2 Unlock
Step: 3 Unlock