

Question: Which of the graphical element below DO NOT help facilitate comparisons, during pre-attentive processing? Orientation Texture Length Tone Shape According to Gestalt principles, the Law
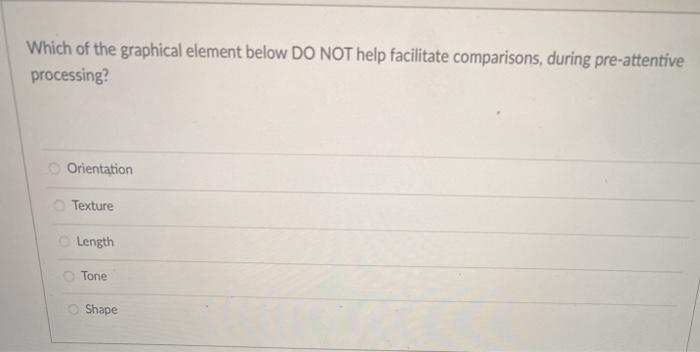
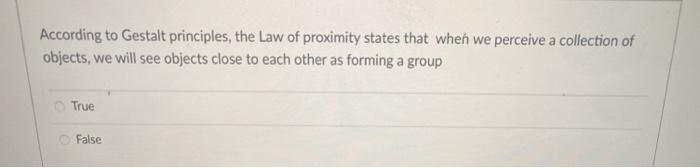
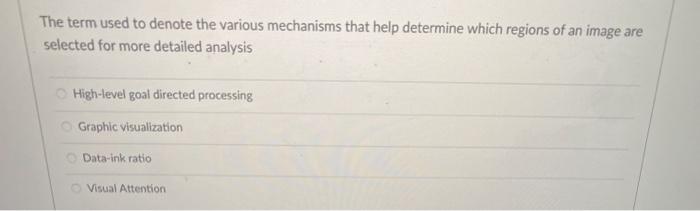
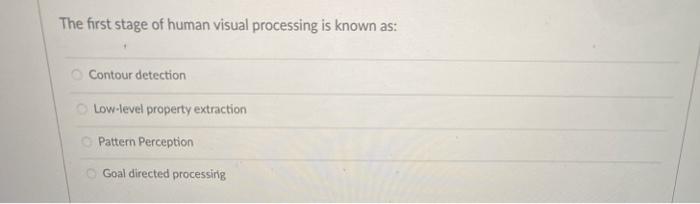
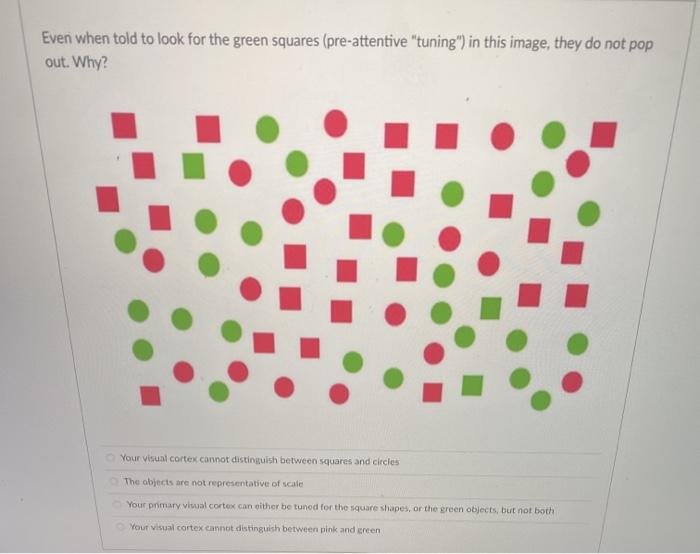
Which of the graphical element below DO NOT help facilitate comparisons, during pre-attentive processing? Orientation Texture Length Tone Shape According to Gestalt principles, the Law of proximity states that when we perceive a collection of objects, we will see objects close to each other as forming a group True False The term used to denote the various mechanisms that help determine which regions of an image are selected for more detailed analysis High-level goal directed processing Graphic visualization Data-ink ratio Visual Attention The first stage of human visual processing is known as: Contour detection Low-level property extraction Pattern Perception Goal directed processing A Minimalist type of line chart that can be placed directly into a cell in Excel is called Sparklines Pivot-chart Bar chart Bubble-chart In a visual chart showing annual sales of products, the categories and sub-categories of items sold would be considered to be a Aggregation Measure Dimension Range value In the ranking of quantitative perception tasks associated with visual encodings, differences in area perception is more accurate to the human eye than differences in positional perception True False Using text to label, reinforce or explain contributes to the of a visual chart Affordance None of the above Accessibility Aesthetics Even when told to look for the green squares (pre-attentive "tuning") in this image, they do not pop out. Why? Your visual cortex cannot distinguish between squares and circles The objects are not representative of scale Your primary visual cortex can either be tunod for the square shapes, or the green objects, but not both Your Visual cortex cannot distinguish between pink and green In Gestalt Principles for form perception, the Law of Closure posits that when we perceive a collection of objects, we will see objects close to each other as forming a group we perceptually close up, or complete, objects that are not, in fact, complete elements will be grouped perceptually together if they are similar to each other when we perceive objects, we tend to perceive them as symmetrical shapes that form around their center To show distribution of quantitative values to help identify shapes and outliers, which is the chart type you will not use Bar histogram Donut Chart Line histogram Scatter plot
Step by Step Solution
There are 3 Steps involved in it

Get step-by-step solutions from verified subject matter experts