

Question: Which pivot fields were used to generate the new chart (table 3). Please explain why and how if possible! Table 3 (Multiple Items) DATE Sum
Which pivot fields were used to generate the new chart (table 3). Please explain why and how if possible!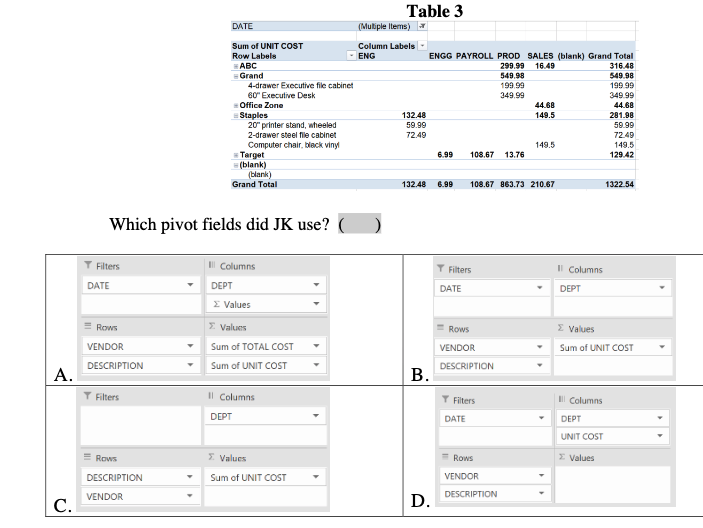
Table 3 (Multiple Items) DATE Sum of UNIT COST Column Labels - Row Labels - ENG ENGG PAYROLL PROD SALES (blank) Grand Total ABC 299,99 16.49 316.48 -Grand 549.98 549.98 4-drawer Executive file cabinet 199.99 199 99 60" Executive Desk 349.99 34999 Office Zone 44.6B 44.68 Staples 132.48 149.5 281.98 20 printer stand, wheeled 59.99 59.99 2-drawer steel file cabinet 72 49 72 49 Computer chair, black vinyl 149.5 149.5 Target 6.99 108.67 13.76 129.42 (blank) blank) Grand Total 132.48 6.99 108.67 963.73 210.67 1322.54 Which pivot fields did JK use? ( ) T Filters T Filters II Columns III Columns DEPT DATE DATE DEPT Values Rows Rows Values VENDOR Values Sum of TOTAL COST Sum of UNIT COST VENDOR Sum of UNIT COST DESCRIPTION DESCRIPTION T Filters II Columns Filters Il Columns DEPT DATE DEPT UNIT COST Rows Values Rows Values DESCRIPTION Sum of UNIT COST VENDOR DESCRIPTION VENDOR
Step by Step Solution
There are 3 Steps involved in it

Get step-by-step solutions from verified subject matter experts