

Question: Which plot is the log-scale plot? What does the slope in the log-scale plot mean? 1) Left plot, Log return of S&P500 index 2) Left
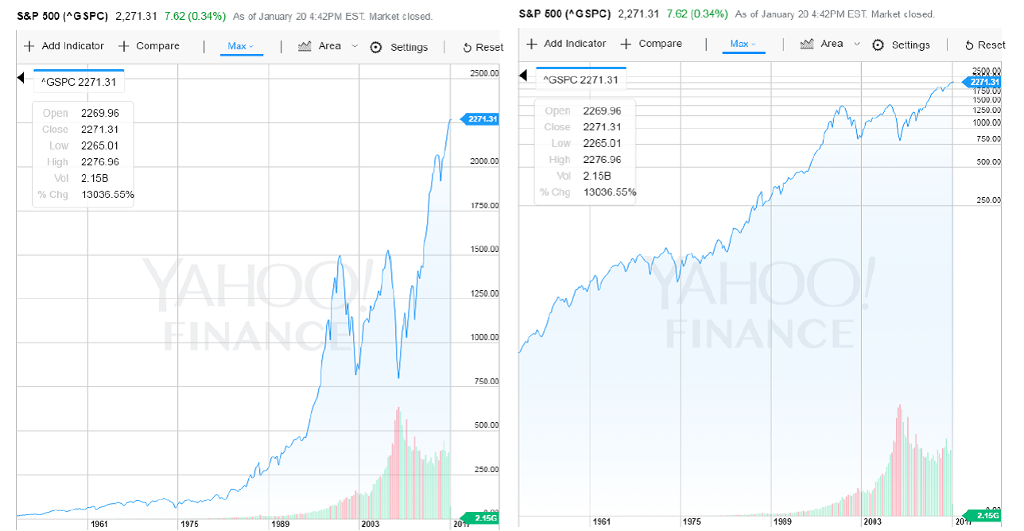
Which plot is the log-scale plot? What does the slope in the log-scale plot mean?
1) Left plot, Log return of S&P500 index
2) Left plot, Change of S&P500 index as a dollar amount
3) Right plot, Log return of S&P500 index
4) Right plot, Change of S&P500 index as a dollar amount
5) None of them, Volatility of S&P500 index
S&P 500rGSPC) 2,271.31 .62(0.34%) Asof January 20 4:42PM EST. Market closed. S&P 600 (^GSPC) 2,271.31 7.62 (0.34%) As of January 20 4:42PM EST Market closed. l-1 Area . O settings Reset + + compare Area .. O settings +Add Indicator Compare Add Indicator Reset GSPC 2271.31 GSPC 2271.31 open 2269.96 Close 1500 1250 1000 2269.96 2271.31 Low 2265.01 High 227696 Open Closc 2271.31 2271.31 2265.01 2276.96 2.158 13036.55% 500 Vol 2.158 %Chg 13036.55% 96 Chg 1750 1000 2.15G 1961 1975 1989 2003 20 1961 1975 1989 2003
Step by Step Solution
There are 3 Steps involved in it

Get step-by-step solutions from verified subject matter experts