

which shows a tide chart for Los Angeles for the week of March 11-17 2021. The y-axis
Fantastic news! We've Found the answer you've been seeking!
Question:
which shows a tide chart for Los Angeles for the week of March 11-17 2021. The y-axis is in units of feet. Based on this graph, what is the approximate tidal period (in hours)? On Sunday, March 14, what will be the tidal range (in feet)? How many high tides occur each day? What type of tides are occurring on the Los Angeles coast? Why do high and low tides not occur at the same time each day? Will the tidal range in Los Angeles be larger or smaller in July? Why? 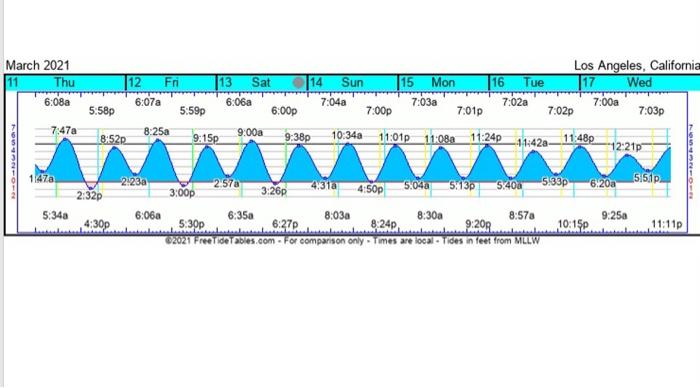
Expert Answer:
The approximate tidal period is 1213 hours between two high tides and also between two low tide... View the full answer

Related Book For 

Statistical Reasoning for Everyday Life
ISBN: 978-0321817624
4th edition
Authors: Jeff Bennett, Bill Briggs, Mario F. Triola
Posted Date:
