

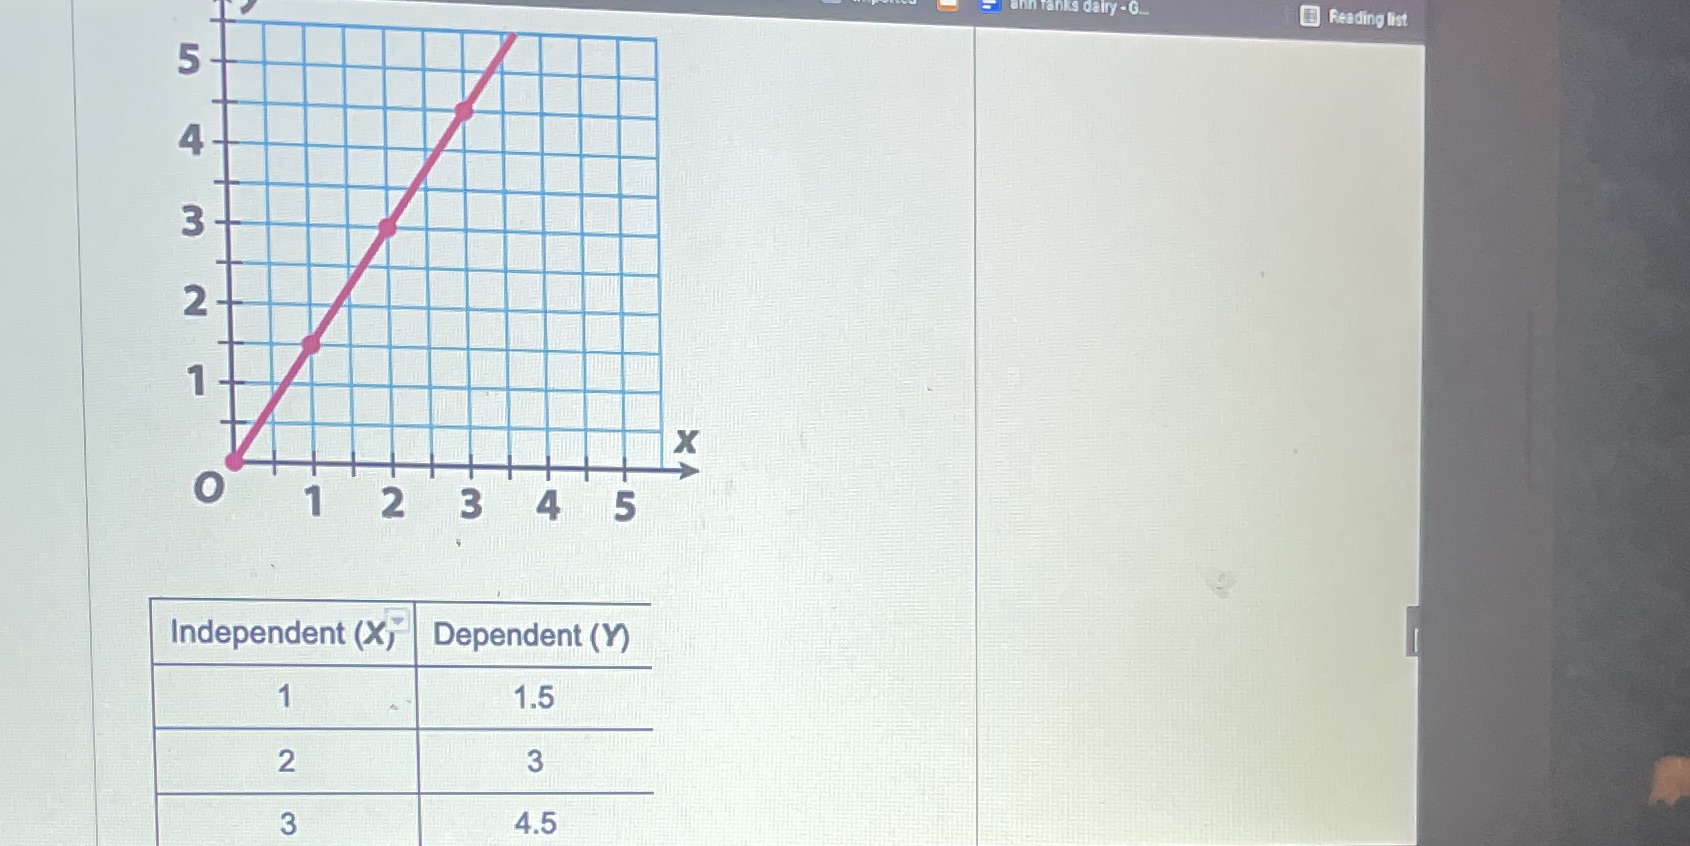
Question: Which table represents the relationship between the independent and dependent variables shown in the graph explain why you chose that table. This is 6th grade
Which table represents the relationship between the independent and dependent variables shown in the graph explain why you chose that table. This is 6th grade math please make it simple
Step by Step Solution
There are 3 Steps involved in it
1 Expert Approved Answer
Step: 1 Unlock

Question Has Been Solved by an Expert!
Get step-by-step solutions from verified subject matter experts
Step: 2 Unlock
Step: 3 Unlock