

Question: Why are ratios useful? What three groups use ratio analysis and for what reasons? Refer to the above companys financial statements. Calculate the current and
- Why are ratios useful? What three groups use ratio analysis and for what reasons?
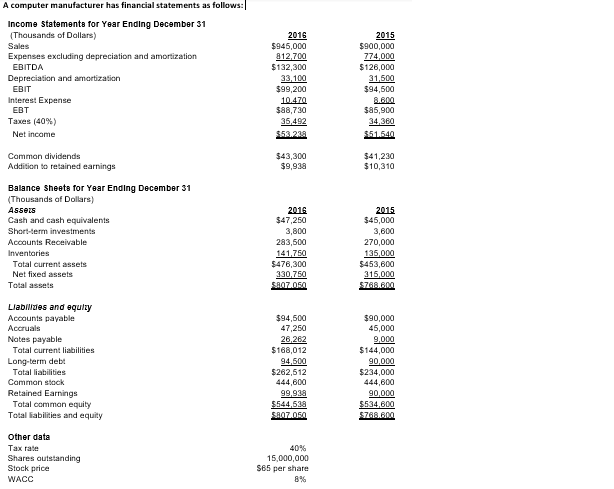
- Refer to the above companys financial statements. Calculate the current and quick ratios. Has the companys liquidity position improved or worsened? Explain.
- Calculate the inventory turnover, days sales outstanding (DSO), fixed assets turnover, and total assets turnover. Has the companys ability to manage its assets improved or worsened? Explain.
- Calculate the profit margin, basic earning power (BEP), return on assets (ROA), and return on equity (ROE). How has the companys profitability changed during the last year?
- What are the firms major strengths and weaknesses? (The industry averages are listed below for reference)
A computer manufacturer has financial statements as follows: Income Statements for Year Ending December 31 Thousands of Dollars) Sales Expenses excluding depreciation and amortization EBITDA Depreciation and amortization EBIT Interest Expense EBT Taxes (40%) Net income 2016 5945,000 812.700 $132.300 33.100 $99,200 10.470 $88.730 35,492 $53.238 2015 $900,000 774,000 $126,000 31,600 $94,500 8.800 $85,900 34 360 $51.540 Common dividends Addition to retained earnings $43,300 $9,938 $41,230 $10,310 Balance Sheets for Year Ending December 31 (Thousands of Dollars) Assets Cash and cash equivalents Short-term investments Acoounts Receivable Inventaries Tatal current assets Net fixed assets Total assets 2015 $47,250 3,800 283,500 141750 5476,300 330,750 SRAZAS 2015 $45,000 3.600 270,000 135,000 $453,600 315,000 576.AR Llabilizes and equizy Accounts payable Accruals Nates payable Tatal current liabilities Long-term debt Tatal liabilities Camman stock Retained Earnings Total common equity Total liabilities and equity 594,500 47,250 26,262 $168,012 94,500 $262,512 444,600 99,938 $544,538 SR07.050 $90,000 45,000 9,000 $144,000 90,000 $234.000 444.600 90.000 $534,600 S768.00 Other data Tax rate Shares outstanding Stock price 40% 15,000,000 $65 per share WACC 3% A computer manufacturer has financial statements as follows: Income Statements for Year Ending December 31 Thousands of Dollars) Sales Expenses excluding depreciation and amortization EBITDA Depreciation and amortization EBIT Interest Expense EBT Taxes (40%) Net income 2016 5945,000 812.700 $132.300 33.100 $99,200 10.470 $88.730 35,492 $53.238 2015 $900,000 774,000 $126,000 31,600 $94,500 8.800 $85,900 34 360 $51.540 Common dividends Addition to retained earnings $43,300 $9,938 $41,230 $10,310 Balance Sheets for Year Ending December 31 (Thousands of Dollars) Assets Cash and cash equivalents Short-term investments Acoounts Receivable Inventaries Tatal current assets Net fixed assets Total assets 2015 $47,250 3,800 283,500 141750 5476,300 330,750 SRAZAS 2015 $45,000 3.600 270,000 135,000 $453,600 315,000 576.AR Llabilizes and equizy Accounts payable Accruals Nates payable Tatal current liabilities Long-term debt Tatal liabilities Camman stock Retained Earnings Total common equity Total liabilities and equity 594,500 47,250 26,262 $168,012 94,500 $262,512 444,600 99,938 $544,538 SR07.050 $90,000 45,000 9,000 $144,000 90,000 $234.000 444.600 90.000 $534,600 S768.00 Other data Tax rate Shares outstanding Stock price 40% 15,000,000 $65 per share WACC 3%
Step by Step Solution
There are 3 Steps involved in it

Get step-by-step solutions from verified subject matter experts