

Question: Why do the different project metrics shown suggest different rankings in terms of the best project? If there is one best metric to use in
- Why do the different project metrics shown suggest different rankings in terms of the best project? If there is one best metric to use in deciding on projects to pursue, is there any merit to calculating the other project performance measures? Explain.
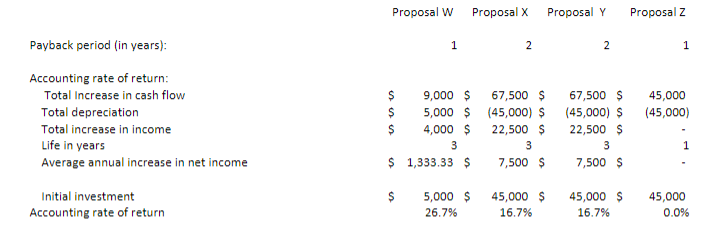
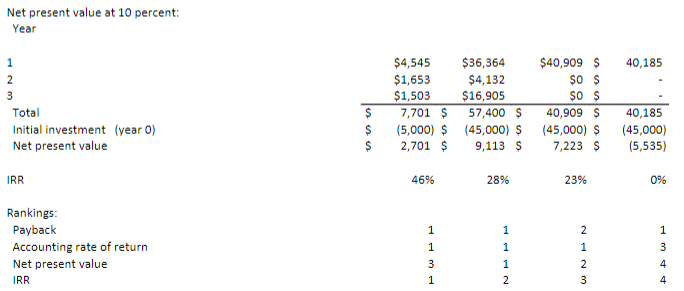
Proposal w Proposal Proposal Y Proposal z Payback period (in years): 1 2 2 1 45,000 (45,000) Accounting rate of return; Total Increase in cash flow Total depreciation Total increase in income Life in years Average annual increase in net income S 9,000 $ 67,500 $ $ 5,000 $ (45,000) $ $ 4,000 $ 22,500 $ 3 3 $ 1,333.33 $ 7,500 $ 67,500 $ (45,000) $ 22,500 $ 3 7,500 $ 1 $ Initial investment Accounting rate of return 5,000 $ 26.7% 45,000 $ 16.7% 45,000 $ 16.7% 45,000 0.0% Net present value at 10 percent: Year 40,185 1 2 3 Total Initial investment (year o) Net present value $ $ $ $4,545 $36,364 $40,909 $ $1,653 $4,132 $0 $ $1,503 $16,905 $0 $ 7,701 $ 57,400 $ 40,909 S (5,000) $ (45,000) $ (45,000) $ 2,701 $ 9,113 $ 7,223 $ 40,185 (45,000) (5,535) IRR 46% 28% 23% 0% Rankings: Payback Accounting rate of return Net present value IRR 1 1 3 1 1 3 1 1 1 2 NA W NN 2 1 2 3 4 4
Step by Step Solution
There are 3 Steps involved in it

Get step-by-step solutions from verified subject matter experts