

Question: Why is my input and output waveform not same? One is from matlab using Fourier series approximation for input, one is from multisim using resistor
Why is my input and output waveform not same? One is from matlab using Fourier series approximation for input, one is from multisim using resistor and capacitor as low pass. Is my matlab coding wrong? Or is my multisim wrong? Below shows my matlab coding. Please teach me Thank you. Below is my matlab coding:
fe; Fundamental frequency Hz
T f; Fundamental period
omega pi f; Angular frequency
fc e; Cutoff frequency of the lowpass filter Hz
Number of periods I want, so that i can easily manage the xaxis here,
make it show more periods or less periods
NT;
Frequency domain display limit
Freqxaxis e;
Time vector, xaxis, for time domain
t NTT : e : NTT;
DCComponent ;
ACComponent zerossizet;
for n ::
bn n pi;
ACComponent ACComponent bn sinn omega t;
end
xt DCComponent ACComponent;
Compute the Frequency Domain, Xw
Building a new axis, for frequency
N lengtht; Number of samples
t means nd element of the array
Fs t t; Sampling frequency
The new xaxis arrayvector is
f N: NFs N;
Get the input into frequency domain
Xf fftxt;
Shift the DC component to the center
Xf fftshiftXf;
Normalize the Xf
Xf Xf N;
The magnitude of Low Pass Filter Transfer function, in frequency domain
Hfmag sqrtf fc;
Calculate the output, filtered, in frequency domain or apply the filter to the frequency domain representation of xt
Yf Hfmag Xf; not absxf cuz khz should show about same graph
Convert the output to the time domain
By doing inverse fourier transform
yt ifftifftshiftYf N;
All plots put together here to easily manage and modify all the plots
figure;
Input, in the Time Domain
input of filter
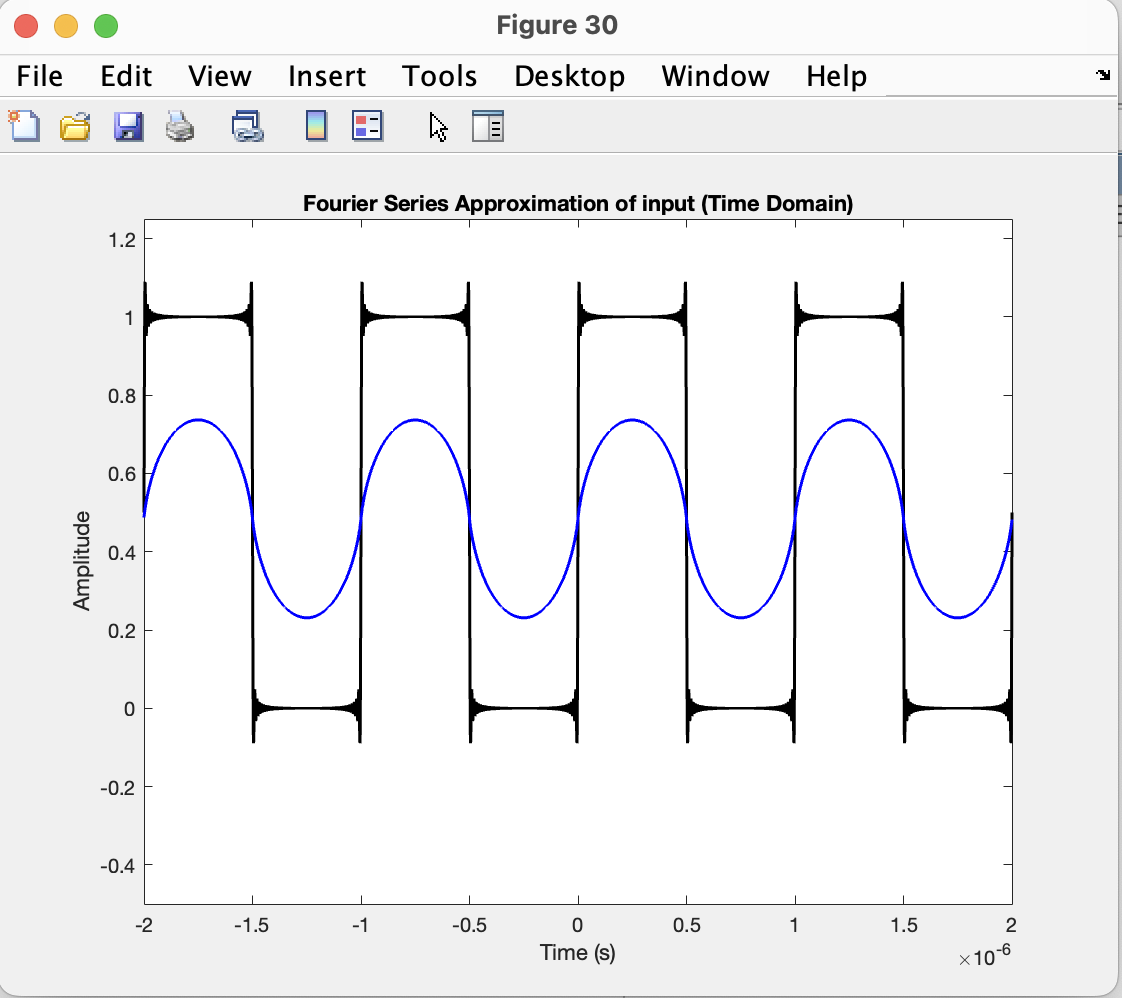
plott xtk 'LineWidth', ;
hold on
output of filter
plott absytb 'LineWidth', ;
titleFourier Series Approximation of input Time Domain;
xlabelTime s;
ylabelAmplitude;
Set yaxis limits
clear ylim need this clear ylim or it bugged one, can't work as expected
ylim;
figure;
Input, in the Time Domain
subplot;
input of filter
plott xtk 'LineWidth', ;
hold on
output of filter
plott absytb 'LineWidth', ;
titleFourier Series Approximation of input Time Domain;
xlabelTime s;
ylabelAmplitude;
Set yaxis limits
clear ylim need this clear ylim or it bugged one, can't work as expected
ylim;
Frequency domain, use the f as x axis
Input, in the Frequency Domain
subplot;
plotf absXfk 'LineWidth', ;
Since making the xaxis has label kHz then the xaxis need to be divided
by k but don't do this, because matlab there auto shows e something,
then gets very messy!!!
titleFourier Series Approximation of magnitude of input Frequency Domain;
xlabelFrequency Hz;
ylabelXf;
xlimFreqxaxis Freqxaxis;
ylim;
grid on;
Hf Low Pass Transfer function, in Frequency Domain
Compared to that sketched by desmos, the points, this is confirmed correct
subplot;
plotf Hfmag, k 'LineWidth', ;
titleHfFrequency Domain;
xlabelFrequency Hz;
ylabelAmplitude;
xlimFreqxaxis Freqxaxis;
grid on;
Filtered Signal in Time Domain
subplot;
plott absytk 'LineWidth', ;
titleFiltered Signal Time Domain;
xlabelTime s;
ylabelAmplitude;
clear ylim
ylim;
Filtered Signal in Frequency Domain
subplot;
plotf absYfk 'LineWidth', ; Timedomain plot of filtered signal
titleFiltered Signal Frequency Domain;
xlabelFrequency Hz;
ylabelAmplitude;
xlimFreqxaxis Freqxaxis;
clear ylim
ylim;
Step by Step Solution
There are 3 Steps involved in it
1 Expert Approved Answer
Step: 1 Unlock

Question Has Been Solved by an Expert!
Get step-by-step solutions from verified subject matter experts
Step: 2 Unlock
Step: 3 Unlock