

Question: will give thumbs up 4. Use the chart below, to answer the following questions: S&P 500: Price Return vs. Total Return Growth of $1 since
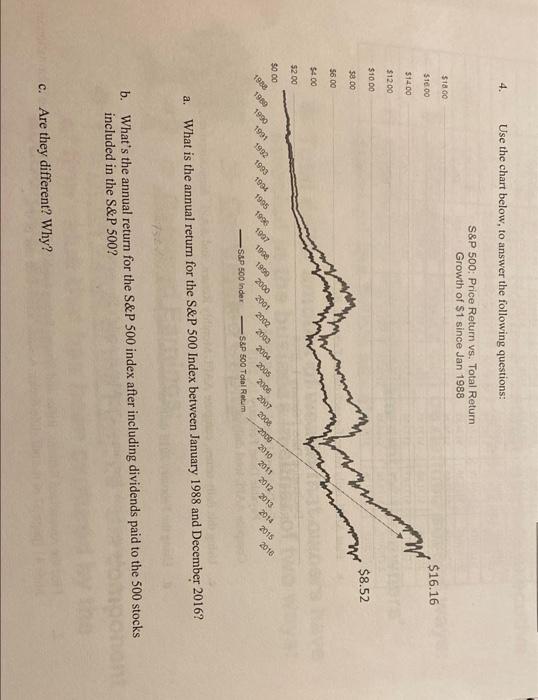
4. Use the chart below, to answer the following questions: S&P 500: Price Return vs. Total Return Growth of $1 since Jan 1988 S18 00 $16.16 $10.00 $14.00 $12.00 $10.00 branging $8.52 $8.00 56.00 $4.00 $200 2011 2010 2000 2008 2010 2015 2014 2013 $0.00 1990 1996 LOOC 0002 ZIOR 1938 1989 1995 4907 1991 1902 1993 1994 1900 1950 S&P 500 Index S&P 500 Total Rotum a. What is the annual return for the S&P 500 Index between January 1988 and December 2016? b. What's the annual return for the S&P 500 index after including dividends paid to the 500 stocks included in the S&P 500? c. Are they different? Why? 4. Use the chart below, to answer the following questions: S&P 500: Price Return vs. Total Return Growth of $1 since Jan 1988 S18 00 $16.16 $10.00 $14.00 $12.00 $10.00 branging $8.52 $8.00 56.00 $4.00 $200 2011 2010 2000 2008 2010 2015 2014 2013 $0.00 1990 1996 LOOC 0002 ZIOR 1938 1989 1995 4907 1991 1902 1993 1994 1900 1950 S&P 500 Index S&P 500 Total Rotum a. What is the annual return for the S&P 500 Index between January 1988 and December 2016? b. What's the annual return for the S&P 500 index after including dividends paid to the 500 stocks included in the S&P 500? c. Are they different? Why
Step by Step Solution
There are 3 Steps involved in it

Get step-by-step solutions from verified subject matter experts