

Question: will you please solve this using excel? A B C D E F G I J Daily price of SP and NASDAQ for 2014 are
 will you please solve this using excel?
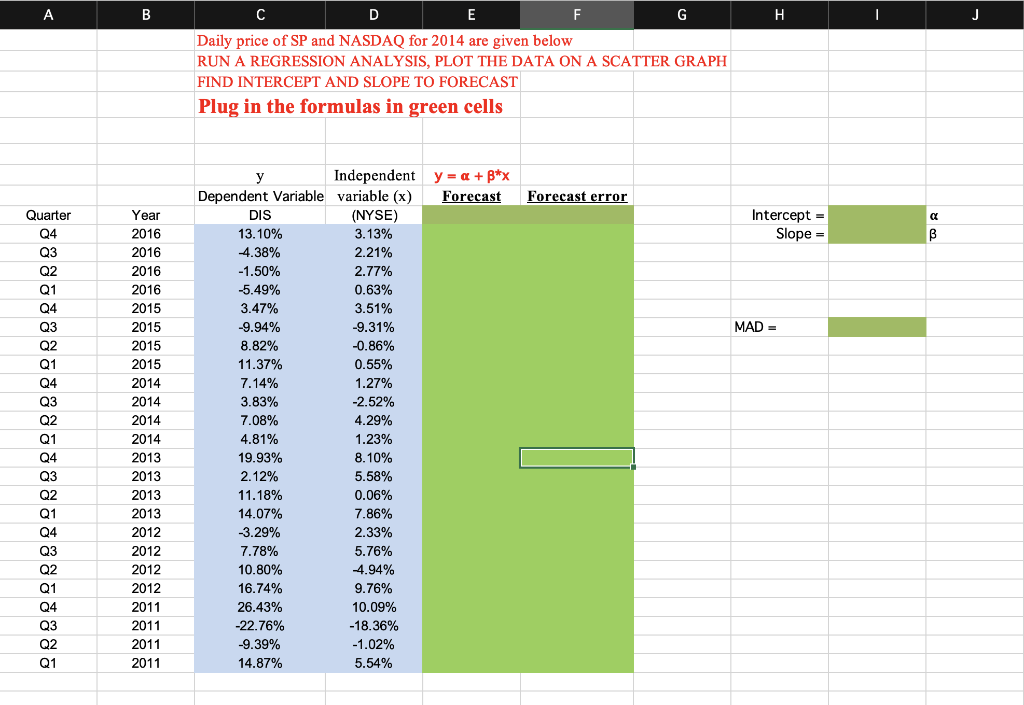
A B C D E F G I J Daily price of SP and NASDAQ for 2014 are given below RUN A REGRESSION ANALYSIS, PLOT THE DATA ON A SCATTER GRAPH FIND INTERCEPT AND SLOPE TO FORECAST Plug in the formulas in green cells MAD= A B C D E F G I J Daily price of SP and NASDAQ for 2014 are given below RUN A REGRESSION ANALYSIS, PLOT THE DATA ON A SCATTER GRAPH FIND INTERCEPT AND SLOPE TO FORECAST Plug in the formulas in green cells MAD=
Step by Step Solution
There are 3 Steps involved in it
1 Expert Approved Answer
Step: 1 Unlock

Question Has Been Solved by an Expert!
Get step-by-step solutions from verified subject matter experts
Step: 2 Unlock
Step: 3 Unlock