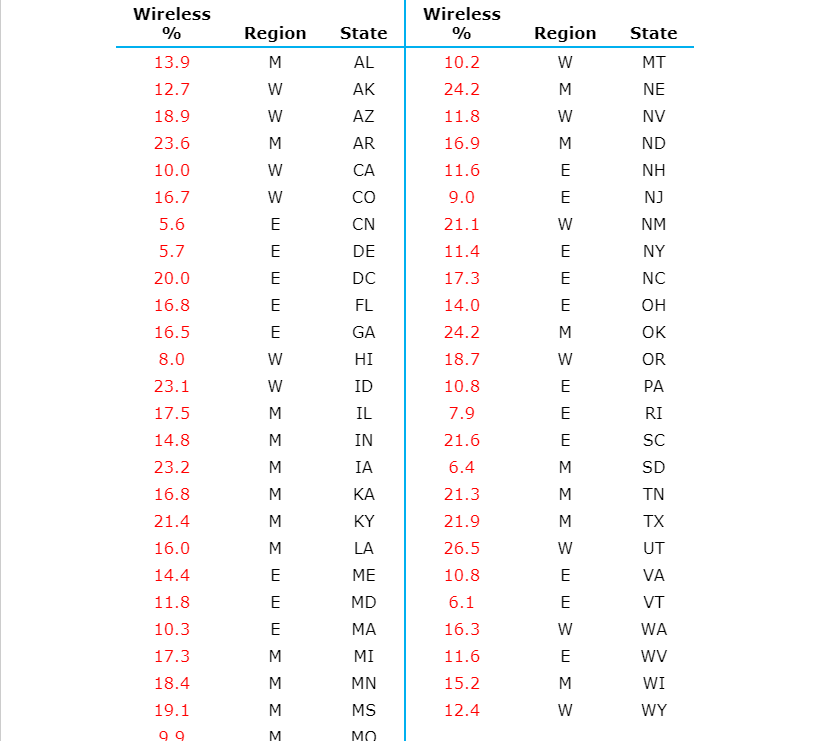
Question: Wireless % State Wireless % 13.9 12.7 Region M W AL 10.2. 24.2 Region w M AK State MT NE NV ND 18.9 23.6 10.0

Wireless % State Wireless % 13.9 12.7 Region M WWireless % State Wireless % 13.9 12.7 Region M WWireless % State Wireless % 13.9 12.7 Region M W

Wireless % State Wireless % 13.9 12.7 Region M W AL 10.2. 24.2 Region w M AK State MT NE NV ND 18.9 23.6 10.0 11.8 16.9 NH 16.7 5.6 W w E E E 11.6 9.0 21.1 11.4 5.7 20.0 16.8 16.5 AZ AR CA CO CN DE DC FL GA HI ID IL IN IA NJ NM NY NC OH OK OR PA 17.3 14.0 24.2. E E 18.7 10.8 7.9 RI 8.0 23.1 17.5 14.8 23.2 16.8 21.4 16.0 3 3 3 3 3 3 21.6 6.4 KA 3 3 KY SC SD TN TX UT VA VT 21.3 21.9 26.5 10.8 6.1 16.3 14.4 11.8 E LA ME MD MA MI MN MS WA 10.3 17.3 18.4 19.1 11.6 15.2 12.4 WV WI WY MO 9.9 MO (a) Construct a stem-and-leaf display for the wireless percentage using the data from all 50 states and the District of Columbia. (Truncate each leaf at the ones digit. Split the stems, placing leaves 0 to 4 on the first stem and leaves 5 to 9 on the second stem of the same value. Enter numbers from smallest to largest separated by spaces. Enter NONE for stems with no values.) stem leaf OH 556779999 X 1L 00111111222444 x 1H 5566666667777899 X 2L 00011233344 2H5 x What is a typical value for this data set? O A typical percentage of households with only a wireless phone is around 28%. O A typical percentage of households with only a wireless phone is around 24%. O A typical percentage of households with only a wireless phone is around 11%. O A typical percentage of households with only a wireless phone is around 3%. O A typical percentage of households with only a wireless phone is around 16%. (b) Construct a back-to-back stem-and-leaf display for the wireless percentage of the states in the West and the states in the East. (Truncate each leaf at the ones digit. Split the stems, placing leaves 0 to 4 on the first stem and leaves 5 to 9 on the second stem of the same value. Enter numbers from smallest to largest separated by spaces. Enter NONE for stems with no values.) West East 8 OH 566789 x 012 X 1L 1111123 6778 x 1H 5777 13 X 2L 00 5 x 2H None A typical percentage of households with only a wireless phone is around 28%. A typical percentage of households with only a wireless phone is around 24%. A typical percentage of households with only a wireless phone is around 11%. A typical percentage of households with only a wireless phone is around 3%. O A typical percentage of households with only a wireless phone is around 16%. (b) Construct a back-to-back stem-and-leaf display for the wireless percentage of the states in the West and the states in the East. (Truncate each leaf at the ones digit. Split the stems, placing leaves 0 to 4 on the first stem and leaves 5 to 9 on the second stem of the same value. Enter numbers from smallest to largest separated by spaces. Enter NONE for stems with no values.) West East 8 OH 566789 012 1L 1111123 xx 6778 1H 5777 13 x 2L 00 x 5 x 2H None How do the distributions of wireless percentages compare for states in the East and states in the West? O A typical percentage of households with only a wireless phone in the West is greater than in the East. There is a slightly greater spread of values in the West than in the East. Neither distribution has any obvious outliers. O A typical percentage of households with only a wireless phone in the East is greater than in the West. There is a slightly greater spread of values in the West than in the East. Both distributions have multiple obvious outliers. O A typical percentage of households with only a wireless phone in the East is greater than in the West. There is a slightly greater spread of values in the East than in the West. Both distributions have multiple obvious outliers. O A typical percentage of households with only a wireless phone in the East is greater than in the West. There is a slightly greater spread of values in the West than in the East. Neither distribution has any obvious outliers. A typical percentage of households with only a wireless phone in the West is greater than in the East. There is a slightly greater spread of values in the West than in the East. Both distributions have multiple obvious outliers. Wireless % State Wireless % 13.9 12.7 Region M W AL 10.2. 24.2 Region w M AK State MT NE NV ND 18.9 23.6 10.0 11.8 16.9 NH 16.7 5.6 W w E E E 11.6 9.0 21.1 11.4 5.7 20.0 16.8 16.5 AZ AR CA CO CN DE DC FL GA HI ID IL IN IA NJ NM NY NC OH OK OR PA 17.3 14.0 24.2. E E 18.7 10.8 7.9 RI 8.0 23.1 17.5 14.8 23.2 16.8 21.4 16.0 3 3 3 3 3 3 21.6 6.4 KA 3 3 KY SC SD TN TX UT VA VT 21.3 21.9 26.5 10.8 6.1 16.3 14.4 11.8 E LA ME MD MA MI MN MS WA 10.3 17.3 18.4 19.1 11.6 15.2 12.4 WV WI WY MO 9.9 MO (a) Construct a stem-and-leaf display for the wireless percentage using the data from all 50 states and the District of Columbia. (Truncate each leaf at the ones digit. Split the stems, placing leaves 0 to 4 on the first stem and leaves 5 to 9 on the second stem of the same value. Enter numbers from smallest to largest separated by spaces. Enter NONE for stems with no values.) stem leaf OH 556779999 X 1L 00111111222444 x 1H 5566666667777899 X 2L 00011233344 2H5 x What is a typical value for this data set? O A typical percentage of households with only a wireless phone is around 28%. O A typical percentage of households with only a wireless phone is around 24%. O A typical percentage of households with only a wireless phone is around 11%. O A typical percentage of households with only a wireless phone is around 3%. O A typical percentage of households with only a wireless phone is around 16%. (b) Construct a back-to-back stem-and-leaf display for the wireless percentage of the states in the West and the states in the East. (Truncate each leaf at the ones digit. Split the stems, placing leaves 0 to 4 on the first stem and leaves 5 to 9 on the second stem of the same value. Enter numbers from smallest to largest separated by spaces. Enter NONE for stems with no values.) West East 8 OH 566789 x 012 X 1L 1111123 6778 x 1H 5777 13 X 2L 00 5 x 2H None A typical percentage of households with only a wireless phone is around 28%. A typical percentage of households with only a wireless phone is around 24%. A typical percentage of households with only a wireless phone is around 11%. A typical percentage of households with only a wireless phone is around 3%. O A typical percentage of households with only a wireless phone is around 16%. (b) Construct a back-to-back stem-and-leaf display for the wireless percentage of the states in the West and the states in the East. (Truncate each leaf at the ones digit. Split the stems, placing leaves 0 to 4 on the first stem and leaves 5 to 9 on the second stem of the same value. Enter numbers from smallest to largest separated by spaces. Enter NONE for stems with no values.) West East 8 OH 566789 012 1L 1111123 xx 6778 1H 5777 13 x 2L 00 x 5 x 2H None How do the distributions of wireless percentages compare for states in the East and states in the West? O A typical percentage of households with only a wireless phone in the West is greater than in the East. There is a slightly greater spread of values in the West than in the East. Neither distribution has any obvious outliers. O A typical percentage of households with only a wireless phone in the East is greater than in the West. There is a slightly greater spread of values in the West than in the East. Both distributions have multiple obvious outliers. O A typical percentage of households with only a wireless phone in the East is greater than in the West. There is a slightly greater spread of values in the East than in the West. Both distributions have multiple obvious outliers. O A typical percentage of households with only a wireless phone in the East is greater than in the West. There is a slightly greater spread of values in the West than in the East. Neither distribution has any obvious outliers. A typical percentage of households with only a wireless phone in the West is greater than in the East. There is a slightly greater spread of values in the West than in the East. Both distributions have multiple obvious outliers

Step by Step Solution

There are 3 Steps involved in it

1 Expert Approved Answer
Step: 1 Unlock blur-text-image
Question Has Been Solved by an Expert!

Get step-by-step solutions from verified subject matter experts

Step: 2 Unlock
Step: 3 Unlock

Students Have Also Explored These Related General Management Questions!