

Question: With a clear explination please Answer is A., why? thanks The following table is a summation of manufacturing and product sales profits from a 5-year
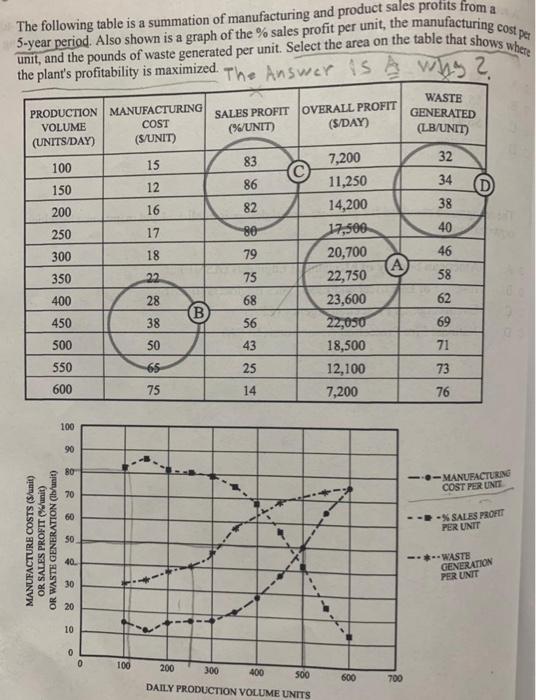
The following table is a summation of manufacturing and product sales profits from a 5-year period. Also shown is a graph of the % sales profit per unit, the manufacturing cost per unit, and the pounds of waste generated per unit. Select the area on the table that shows where the plant's profitability is maximized. The Answer is why ? PRODUCTION MANUFACTURING VOLUME COST (UNITS/DAY) (S/UNIT) SALES PROFIT OVERALL PROFIT (%/UNIT) (SDAY) WASTE GENERATED (LB/UNIT) 32 7,200 83 100 15 86 12 34 11,250 150 200 16 82 14,200 38 250 17 80 40 17,500 20,700 300 18 79 46 A 350 22 75 22,750 58 400 28 68 62 B 23,600 22,050 450 38 56 69 500 50 43 18,500 71 550 65 25 73 12,100 7,200 600 75 14 76 100 90 80 ---MANUFACTURING COST PER UNIT -- SALES PROFIT PER UNIT MANUFACTURE COSTS (S/unit) OR SALES PROFIT unit) OR WASTE GENERATION (h/anit) 50 ----WASTE 40 GENERATION PER UNIT 20 10 0 100 200 300 400 500 600 700 DAILY PRODUCTION VOLUME UNITS The following table is a summation of manufacturing and product sales profits from a 5-year period. Also shown is a graph of the % sales profit per unit, the manufacturing cost per unit, and the pounds of waste generated per unit. Select the area on the table that shows where the plant's profitability is maximized. The Answer is why ? PRODUCTION MANUFACTURING VOLUME COST (UNITS/DAY) (S/UNIT) SALES PROFIT OVERALL PROFIT (%/UNIT) (SDAY) WASTE GENERATED (LB/UNIT) 32 7,200 83 100 15 86 12 34 11,250 150 200 16 82 14,200 38 250 17 80 40 17,500 20,700 300 18 79 46 A 350 22 75 22,750 58 400 28 68 62 B 23,600 22,050 450 38 56 69 500 50 43 18,500 71 550 65 25 73 12,100 7,200 600 75 14 76 100 90 80 ---MANUFACTURING COST PER UNIT -- SALES PROFIT PER UNIT MANUFACTURE COSTS (S/unit) OR SALES PROFIT unit) OR WASTE GENERATION (h/anit) 50 ----WASTE 40 GENERATION PER UNIT 20 10 0 100 200 300 400 500 600 700 DAILY PRODUCTION VOLUME UNITS
Step by Step Solution
There are 3 Steps involved in it

Get step-by-step solutions from verified subject matter experts