

Question: With reference to Figure 2, form an equation to represent the signal and sketch its frequency domain plot. 0.2 0.4 0.6 time, s Figure 2:
With reference to Figure 2, form an equation to represent the signal and sketch its frequency domain plot.
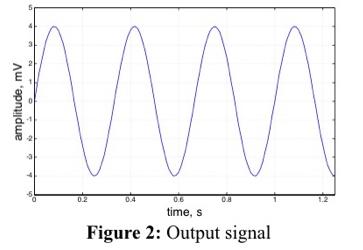
0.2 0.4 0.6 time, s Figure 2: Output signal amplitude, mV
Step by Step Solution
★★★★★
3.47 Rating (154 Votes )
There are 3 Steps involved in it
1 Expert Approved Answer
Step: 1 Unlock

To solve this lets break it down into steps Step 1 Analyze the Time Domain Signal From the graph ide... View full answer
Question Has Been Solved by an Expert!
Get step-by-step solutions from verified subject matter experts
Step: 2 Unlock
Step: 3 Unlock