

Question: With Reference to IBM 2009 Annual report: Forward-Looking and Cautionary Statements Certain statements contained in this Annual Report may constitute forward-looking statements within the meaning
With Reference to IBM 2009 Annual report:
Forward-Looking and Cautionary Statements
Certain statements contained in this Annual Report may constitute forward-looking statements within the meaning of the Private Securities Litigation Reform Act of 1995. These statements involve a number of risks, uncertainties and other factors that could cause actual results to be materially different, as discussed more fully elsewhere in this Annual Report and in the companys filings with the Securities and Exchange Commission (SEC), including the companys 2009 Form 10-K filed on February 23, 2010.
Management Discussion Snapshot
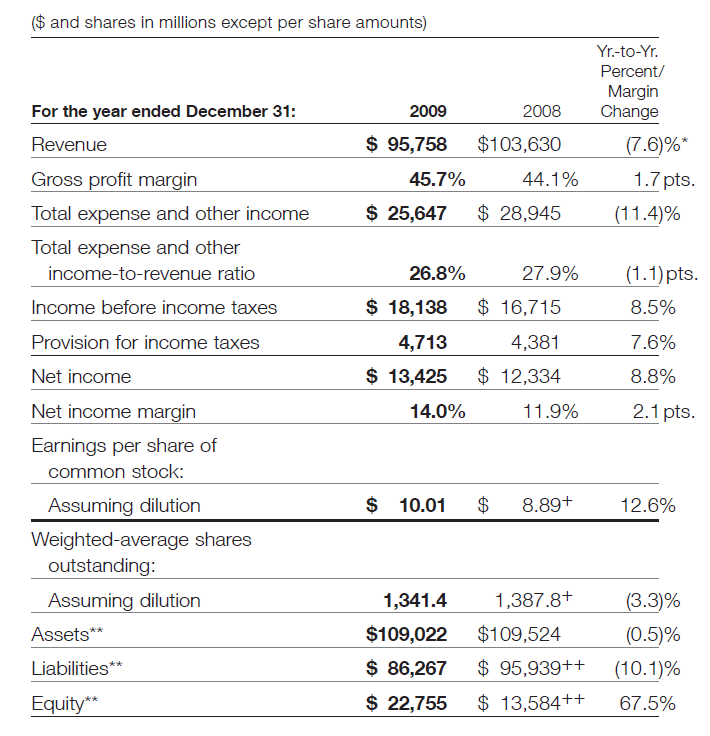
* (5.3) percent adjusted for currency.
** At December 31.
+ Reflects the adoption of the Financial Accounting Standards Board (FASB) guidance in determining whether instruments granted in share-based payment transactions are participating securities. See note B, Accounting Changes, on pages 79 to 82 for additional information.
++ Reflects the adoption of the FASB guidance on noncontrolling interests in consolidated financial statements. See note B, Accounting Changes, on pages 79 to 82 for additional information.
In 2009, in a difficult global economic environment, the company continued to deliver value to its clients and strong financial results to its investorswith profit growth driven by continued margin expansion, expense productivity, market share gains in software and systems and a continuing strong cash position. The company again achieved record levels of pre-tax profit, earnings per share and cash flow from operationsdespite a decline in revenue. The financial performance reflected the strength of the companys global model and the results of the strategic transformation of the business.
The companys transformation, which started at the beginning of the decade, is driven by a combination of shifting the business mix, improving operating leverage through productivity and investing to capture growth opportunities.
The company has exited commoditizing businesses and remixed its portfolio to higher value areas through organic investments and acquisitions. This shift to higher value areas drives a more profitable mix and enables the company to better meet clients needs. In addition, the focus on global integration has improved productivity and efficiency. The companys ongoing initiatives have reduced the fixed cost base and improved the operational balance pointgenerating more profit for each dollar of revenue. The strong profit and cash base has enabled the company to make significant investments for growth and return capital to shareholders. Key areas of investment include Smarter Planet solutions, business analytics, growth market opportunities and new computing models such as cloud computing. The strategic transformation of the company has enabled the company to deliver strong financial performance since the last recession in 2002, including the difficult environment in 2008 and 2009, and has positioned the business for the future.
For the year, the company delivered $10.01 in diluted earnings per share, an increase of 12.6 percent year to year. This was the seventh consecutive year of double-digit earnings per share growth. In 2007, the company developed a road map for growth with earnings per share objective for 2010 of $10 to $11 per share. With its performance in 2009, the company achieved this objective one year early.
Total revenue decreased by 7.6 percent (5 percent adjusted for currency) compared to 2008. Revenue from the growth markets declined 3.5 percent but increased 1 percent at constant currency. The performance was led by the BRIC countries of Brazil, Russia, India, and China which increased 4 percent, adjusted for currency. Segment performance was driven by Software which decreased 3.1 percent year to year (1 percent adjusted for currency) and Global Technology Services which declined 4.9 percent (2 percent adjusted for currency). Within Software, performance was led by key branded middleware which increased revenue 1.1 percent (3 percent adjusted for currency) compared to the prior year.
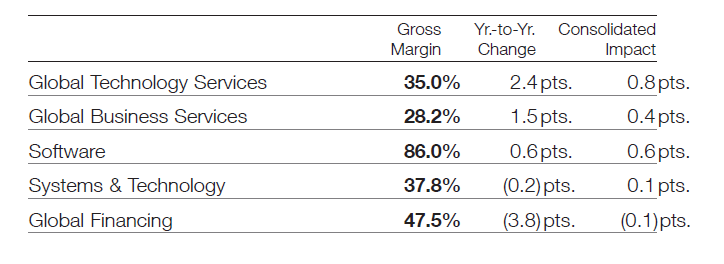
Gross profit margins improved reflecting the shift to higher value businesses and the continued focus on productivity and cost management. The consolidated gross profit margin increased by 1.7 points versus 2008 to 45.7 percent. This was the sixth consecutive year of improvement in the gross profit margin. Gross profit margin performance by segment and the impact to the consolidated gross margin was as follows:
Total expense and other income decreased by 11.4 percent in 2009 versus 2008. The year-to-year drivers were approximate:
Operational expense, (9) points
Currency, (4) points
Acquisitions, 1 point
Pre-tax income grew 8.5 percent and the pre-tax margin was 18.9 percent, the highest level in more than a decade. Net income increased 8.8 percent reflecting a slight improvement in the tax rate. The effective tax rate for 2009 was 26.0 percent, compared with 26.2 percent in 2008.
Diluted earnings per share improved 12.6 percent reflecting the strong growth in net income and the benefits of the common stock repurchase program. In 2009, the company repurchased approximately 69 million shares of its common stock. Diluted earnings per share of $10.01 increased $1.12 from the prior year driven by the following factors:
Revenue decreased at actual rates: $(0.68)
Gross margin increase of 1.7 points: $0.85
Expense productivity: $0.58
Tax rate decrease of 0.2 points: $0.03
Common stock repurchases: $0.34
At December 31, 2009, the companys balance sheet and liquidity positions remained strong. Cash on hand was $12,183 million. Total debt decreased $7,826 million year to year, and the company generated $20,773 million in operating cash flow in 2009. The company has consistently generated strong cash flow from operations and also continues to have access to additional sources of liquidity through the capital markets and its global credit facility.
Key drivers in the companys balance sheet and total cash flows are highlighted below.
Total assets decreased $502 million (decreased $3,885 million adjusted for currency) from December 31, 2008, driven by:
Decreases in cash and cash equivalents ($558 million) and total receivables ($1,301 million); and
Lower deferred taxes ($2,888 million) and intangible assets ($365 million), partially offset by;
Increased goodwill ($1,964 million) and prepaid pension assets ($1,401 million); and
Higher level of marketable securities ($1,625 million).
The company had $13,973 million in cash and marketable securities at December 31, 2009.
Total liabilities decreased $9,672 million (decreased $11,213 million adjusted for currency) from December 31, 2008 driven by:
Lower total debt ($7,826 million);
Decrease in retirement-related benefit obligations ($3,500 million), partially offset by;
Higher tax liabilities ($1,083 million); and
Increased deferred income ($997 million).
Total equity of $22,755 million increased $9,170 million from the prior year-end balance as a result of:
Higher retained earnings ($10,546 million);
Increase in foreign currency translation adjustments ($1,732 million);
Increase in retirement-related items ($1,727 million) and common stock ($2,682 million), partially offset by;
Increased treasury stock ($7,072 million); and
Increased net unrealized losses on cash flow derivatives ($556 million).
The company generated $20,773 million in cash flow provided by operating activities, an increase of $1,961 million, compared to 2008, primarily driven by a decrease in receivables ($1,857 million). Net cash used in investing activities of $6,729 million was $2,556 million lower than 2008, primarily due to the prior year Cognos acquisition and the core logistics operations divestiture in 2009, partially offset by the year-to-year impacts related to marketable securities and other investments.
Net cash used in financing activities of $14,700 million was $2,866 million higher, primarily due to debt repayments ($5,019 million), partially offset by lower common stock repurchases ($3,150 million) in 2009 versus 2008.
Total Global Services signings were $57,094 million, flat (up 2 percent adjusted for currency) versus 2008. The estimated Global Services backlog was $137 billion at December 31, 2009, up $7 billion ($1 billion adjusted for currency) versus the prior year-end balance.
In January 2010, the company disclosed that it is expecting earnings of at least $11.00 per diluted share for the full year 2010.
For additional information and details, see the Year in Review section on pages 25 through 39.
a. what change in IBM revenue, net income, liquidity, leverage, turnover, profitability, and market value is most emblematic of IBM's strategic goals for acquiring ISS?
b. The overall weighted-average useful life of the intangible assets purchased with the acquisition ISS, excluding Goodwill, was 5.6 years. In 2011, what actions by IBM support the 2006 estimate of useful life of the ISS security intangible assets?
$ and shares in millions except per share amounts) Yr.-to-Yr Percent/ Margin 2008 Change For the year ended December 31: Revenue Gross profit margin Total expense and other income Total expense and other 2009 $ 95,758 $103,630 (7.6)%* 1.7pts (11.4)% 45.7% 44.1 % $25,647 $ 28,945 27.9% income-to-revenue ratio Income before income taxes Provision for income taxes Net income Net income margin Earnings per share of (1.1)pts 8.5% 7.6% 8.8% 2.1 pts 26.8% $18,138 $ 16,715 4,381 $ 13,425 $12,334 4,713 14.0% 11.9% common stock: Assuming dilution $ 10.01 $ 8.89+ 12.6% Weighted-average shares outstanding 1.387.8+ $109,524 $95,939++ $ 13,584++ (3.3% (0.5)% (10.1)% 67.5% Assuming dilution Assets** Liabilities** Equity 1,341.4 $109,022 $86,267 $22,755 Gross Yr-to-Yr. Consolidated Margin Change Impact Global Technology Services Global Business Services Software Systems & Technology Global Financin 35.0% 28.2% 86.0% 37.8% 47 5% 2.4 pts 1.5 pts 0.6pts (0.2) pts (3.8) pts 0.8 pts 0.4 pts 0.6 pts 0.1 pts 0.1)pts $ and shares in millions except per share amounts) Yr.-to-Yr Percent/ Margin 2008 Change For the year ended December 31: Revenue Gross profit margin Total expense and other income Total expense and other 2009 $ 95,758 $103,630 (7.6)%* 1.7pts (11.4)% 45.7% 44.1 % $25,647 $ 28,945 27.9% income-to-revenue ratio Income before income taxes Provision for income taxes Net income Net income margin Earnings per share of (1.1)pts 8.5% 7.6% 8.8% 2.1 pts 26.8% $18,138 $ 16,715 4,381 $ 13,425 $12,334 4,713 14.0% 11.9% common stock: Assuming dilution $ 10.01 $ 8.89+ 12.6% Weighted-average shares outstanding 1.387.8+ $109,524 $95,939++ $ 13,584++ (3.3% (0.5)% (10.1)% 67.5% Assuming dilution Assets** Liabilities** Equity 1,341.4 $109,022 $86,267 $22,755 Gross Yr-to-Yr. Consolidated Margin Change Impact Global Technology Services Global Business Services Software Systems & Technology Global Financin 35.0% 28.2% 86.0% 37.8% 47 5% 2.4 pts 1.5 pts 0.6pts (0.2) pts (3.8) pts 0.8 pts 0.4 pts 0.6 pts 0.1 pts 0.1)pts
Step by Step Solution
There are 3 Steps involved in it

Get step-by-step solutions from verified subject matter experts